


The known: Preventable environmental risk factors contribute to about a quarter of global burden of disease. Australian Indigenous voices have long recognised the importance of environmental risks, including housing, on health. Health system costs of these risks are unknown.
The new: Environmental risks cost Northern Territory public hospitals over $72 million annually, with children, those in remote areas and Indigenous people most affected. Skin disease and poor water, sanitation and housing conditions are major contributors.
The implications: Improving housing, water quality and sanitation will prevent disease and reduce health care expenditure. Delivering on environmental health commitments through meaningful partnerships and coordinated action across sectors is essential for closing the gap.
Twenty‐four per cent of global deaths are due to modifiable environmental risk factors, a percentage that rises to 28% of deaths in the under 5‐year age group. Indigenous and remote populations in Australia are disproportionately exposed to these risks.1 In the Northern Territory of Australia, Indigenous Territorians constitute over 30% of the total population, and nearly 50% of Territorians live in remote areas.2 Quantifying the number of hospital separations and associated costs that could be averted by reducing environmental health risks is important to advocate for healthy environment strategies in the NT. This work aligns with broader efforts to inform preventive health policy for Indigenous Australians, including within the Health Sector Strengthening Plan, the National Aboriginal and Torres Strait Islander Health Plan 2021–2031 and the National Agreement on Closing the Gap.3,4,5
A 2006 World Health Organization (WHO) study measured the impact of environmental risks, such as water quality, housing and air pollution on burden of disease, demonstrating how improving environmental conditions enhances health.6 The study estimated population attributable fractions — the proportional reduction in death or disease achievable by removing risk or reducing it to a pragmatic level7 — of a list of diseases and risk factors using best available evidence. Comparative risk assessment data were prioritised; however, when unavailable, calculations relied on limited exposure data, knowledge of transmission pathways and/or expert surveys.6
While this study provides global and WHO regional estimates, highlighting variation between countries, it lacks NT‐specific data.6 Context‐specific data matter, as environmentally attributable disease burdens vary within countries, including Australia.6 In the NT, First Nations people experience high rates of rheumatic heart disease (3005 per 100 000 in 2021).6,8 Yet, the WHO study limits environmentally attributable risk to lead exposure, without noting other relevant environmental risks for rheumatic heart disease in remote Australia, such as overcrowding, water quality, sanitation and hygiene.9
To address this, environmental attributable fractions contextualised to the Kimberley region of Western Australia were developed.10 WHO values formed the base, an expert survey adapted them to the Kimberley, and local estimates were added for region‐specific diseases not covered by the WHO. These were applied to WA primary care data and are now informing policy and programs.
Attributable fractions are widely used to quantify burden and cost of disease linked to preventable risks, highlighting financial benefits of interventions.11,12 For example, an NT study found that every $1 invested in water fluoridation and improved drinking water quality in remote communities could save up to $16 in dental care costs.13 Similar logic has supported effective Australian tobacco control program advocacy.10 Quantifying health system costs of environmental risks in the NT could bolster arguments for action, yet these data are currently lacking.
The aim of this work was to quantify the annual costs of hospital separations attributable to preventable environmental risks in the NT and to inform targeted policy and programs to create and maintain healthy environments.
Methods
Design and setting
This project was a retrospective secondary data analysis of routinely collected administrative data from two sources. The setting was all NT public hospitals between 1 July 2021 and 30 June 2022. We report our study according to the Strengthening the Reporting of Observational Studies in Epidemiology (STROBE) guidelines (Supporting Information, section 1).14
Participants
Inclusion criteria for study participants were inpatient hospital separations (discharge, transfer, death) from public hospitals in the NT between 1 July 2021 and 30 June 2022. Hospital records reflect separations, not individuals, as one person may have multiple separations. The study excluded non‐inpatient presentations, such as outpatient, emergency department and primary care presentations. Population size was determined by separations during the study period.
Variables
In terms of the outcome definition, individual hospital separations were classified as environmentally attributable if the International statistical classification of diseases and related health problems, 10th revision, Australian modification (ICD‐10‐AM) code for their primary diagnosis matched an included disease (Supporting Information, section 2). Separations with an included disease as an additional but not primary diagnosis were not classified as environmentally attributable.
Demographic variables such as age, sex, Indigenous status and geographic location were also assessed. Geographic classification was based on the Australian Statistical Geography Standard.15 NT Health records patient sex by self‐identification, so responses may reflect gender identity. This article uses recorded sex.
Data sources
Deidentified episode‐level hospitalisation data were extracted from the NT Inpatient Activity Database, which routinely collects data for each hospital separation. The dataset included demographic, geographic and clinical characteristics, with diagnoses recorded using ICD‐10‐AM codes. Demographic characteristics such as age, sex and Indigenous status are highly reliable in this dataset.16
Each separation was linked via a unique identifier (same in both databases) to corresponding reimbursement data, obtained from the NT Health’s activity‐based funding database. Data were based on the Australian Refined Diagnosis Related Groups, and incorporated key adjustment factors.17
Contextualisation and validation of the Kimberley disease list to the NT
To contextualise and validate environmentally attributable fractions to the NT, the Kimberley environmental attributable fractions (KEAFs) list from previously published work was manually mapped to ICD‐10‐AM codes by author GL.10 This list was reviewed by an expert advisory panel (five members, one Indigenous) and our Indigenous Steering Committee (four members, all Indigenous), with skills in public health, clinical medicine, environmental health, Aboriginal health and remote health. These groups convened face‐to‐face to contextualise the KEAFs to NT environmentally attributable fractions (NTEAFs).
Certain diseases were added, notably coronavirus disease 2019 (COVID‐19). Others were removed, including mental health, as the panel decided it was out of scope to quantify the environmental determinants of mental health in the NT.
The fractional values from previously published work remained unchanged for the NTEAFs.10 COVID‐19 was categorised under “throat infection”, due to similar disease transmission and symptomatology. ICD‐10‐AM and NTEAF mapping is provided in the Supporting Information (section 2) for replication of methods.
Previously published work grouped environmental risk factors into 12 categories.10 For example, “water quality, sanitation and hygiene” included water treatment, hand hygiene, soap availability and functioning toilets. A complete list has previously been published.10 Each diagnosis was assigned a KEAF per risk factor group (eg, 25% of scabies burden to “water quality, sanitation and hygiene” and 70% to “home condition”). The panel reviewed and retained these groupings for application to NT data.
Data analysis
Data analysis was performed through Stata software. Relevant variables were extracted from the sources described above, ensuring confidentiality, and data were cleaned. Costs were matched to each episode using a unique identifier. Using the contextualised NTEAFs, the cost of hospital separations attributable to each environmental risk factor category was calculated by multiplying the cost of each separation by its corresponding NTEAF, based on the primary diagnosis ICD‐10‐AM code. Descriptive statistics were calculated, including the number, cost and percentage of environmentally attributable separations. Records that were missing demographic variables were excluded from percentage calculations. Costs of each disease and risk factor category were also determined. Subgroup analyses, based on demographics and geography, and aggregate costs were calculated.
Patient and public involvement
This project followed the Maiam nayri Wingara Indigenous Data Sovereignty principles,18 and was governed by our Indigenous Steering Committee with expertise in public and environmental health. Chaired by a Marranunggu man and senior author of this article (MS), it guided contextualisation, decisions regarding secondary deidentification (to prevent identification of cultural and language groups), and dissemination via Aboriginal community‐controlled organisations involved in health and housing. They ensured that communities could meaningfully use the data, supporting sustainable self‐determination through workforce planning and advocacy for funding in environmental health. The research team acknowledges our diverse positionalities and worked in partnership to centre Indigenous governance, knowledge and values throughout the project. Input from the Indigenous Steering Committee was essential in recognising that “Aboriginal and Torres Strait Islander people must determine, drive and own the desired outcomes” to meaningfully close the gap in health disparities.19
Ethics approval
The study protocol was approved by the Human Research Ethics Committee of the Northern Territory Department of Health and Menzies School of Health Research (HREC 2023‐4634).
Results
Between July 2021 and June 2022, there were 174 194 hospital separations, with 12 150 attributable to environmental risk. Box 1 provides an overview of the total number of separations and associated costs attributed to environmental risk across hospital separations. The cost attributable to environmental risk amounted to $72 075 766 — 8% of total inpatient hospital costs. Individual patients may be admitted multiple times, resulting in multiple separations from hospital. Twenty‐one per cent of patients admitted to hospital had an environmentally attributable primary diagnosis.
Box 2 presents the top ten environmentally attributable disease contributors to separations and costs in NT public hospitals. The top contributor was skin infection, including pustules, abscesses, cellulitis and impetigo, contributing $26.4 million in costs. Lower respiratory tract infection and cardiac disease contributed $13.1 and $9.8 million, respectively.
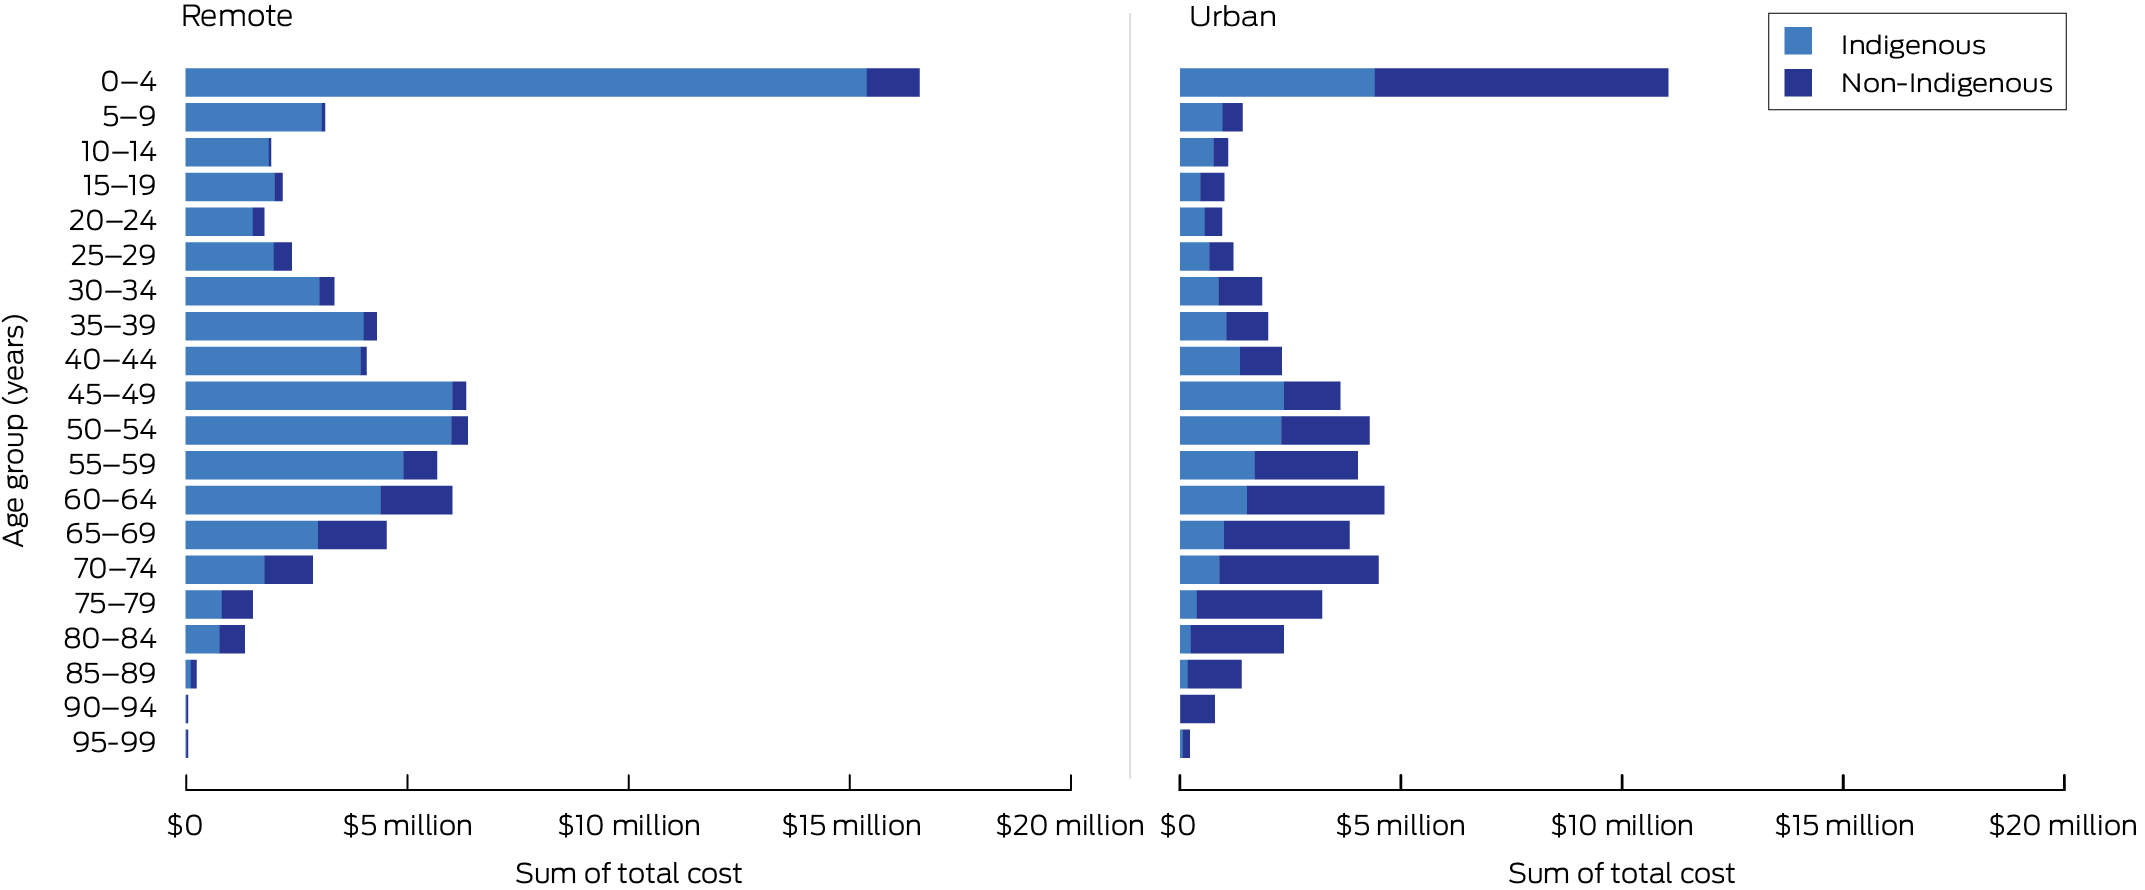
Box 3 categorises environmentally attributable hospital separation costs by age group, sex and Indigenous status. Environmental risks disproportionately affect Indigenous people, with separations costing $47.2 million annually compared with $24.8 million for the non‐Indigenous population.
Box 3 and Box 4 show that health care costs are highest in the 0–4‐year age group for Indigenous populations ($8.2 million, 17% of total costs). The highest cost in the non‐Indigenous population occurs in the 60–64‐year age group ($3.0 million). These data have not been age standardised; there is a younger age distribution of the Indigenous population in the NT, with relatively few Indigenous people reaching older age groups.20
In the inpatient hospital population, costs attributable to environmental risk for non‐Indigenous males are greater ($16.7 million) than for non‐Indigenous females ($8.1 million). The opposite is true for the Indigenous population, with higher costs for females ($25.9 million) compared with males ($21.3 million) (Box 3).
Indigenous people have higher health care costs attributable to environmental risk across all age ranges from ages 0 to 69 years ($44.9 million v $17.7 million). Above the age of 69 years, there is a larger environmentally attributable cost in non‐Indigenous populations ($7.2 million v $2.4 million). The total cost attributable to environmental risks is $41.7 million in remote areas, where differences between Indigenous and non‐Indigenous health care costs are most pronounced (Box 4).
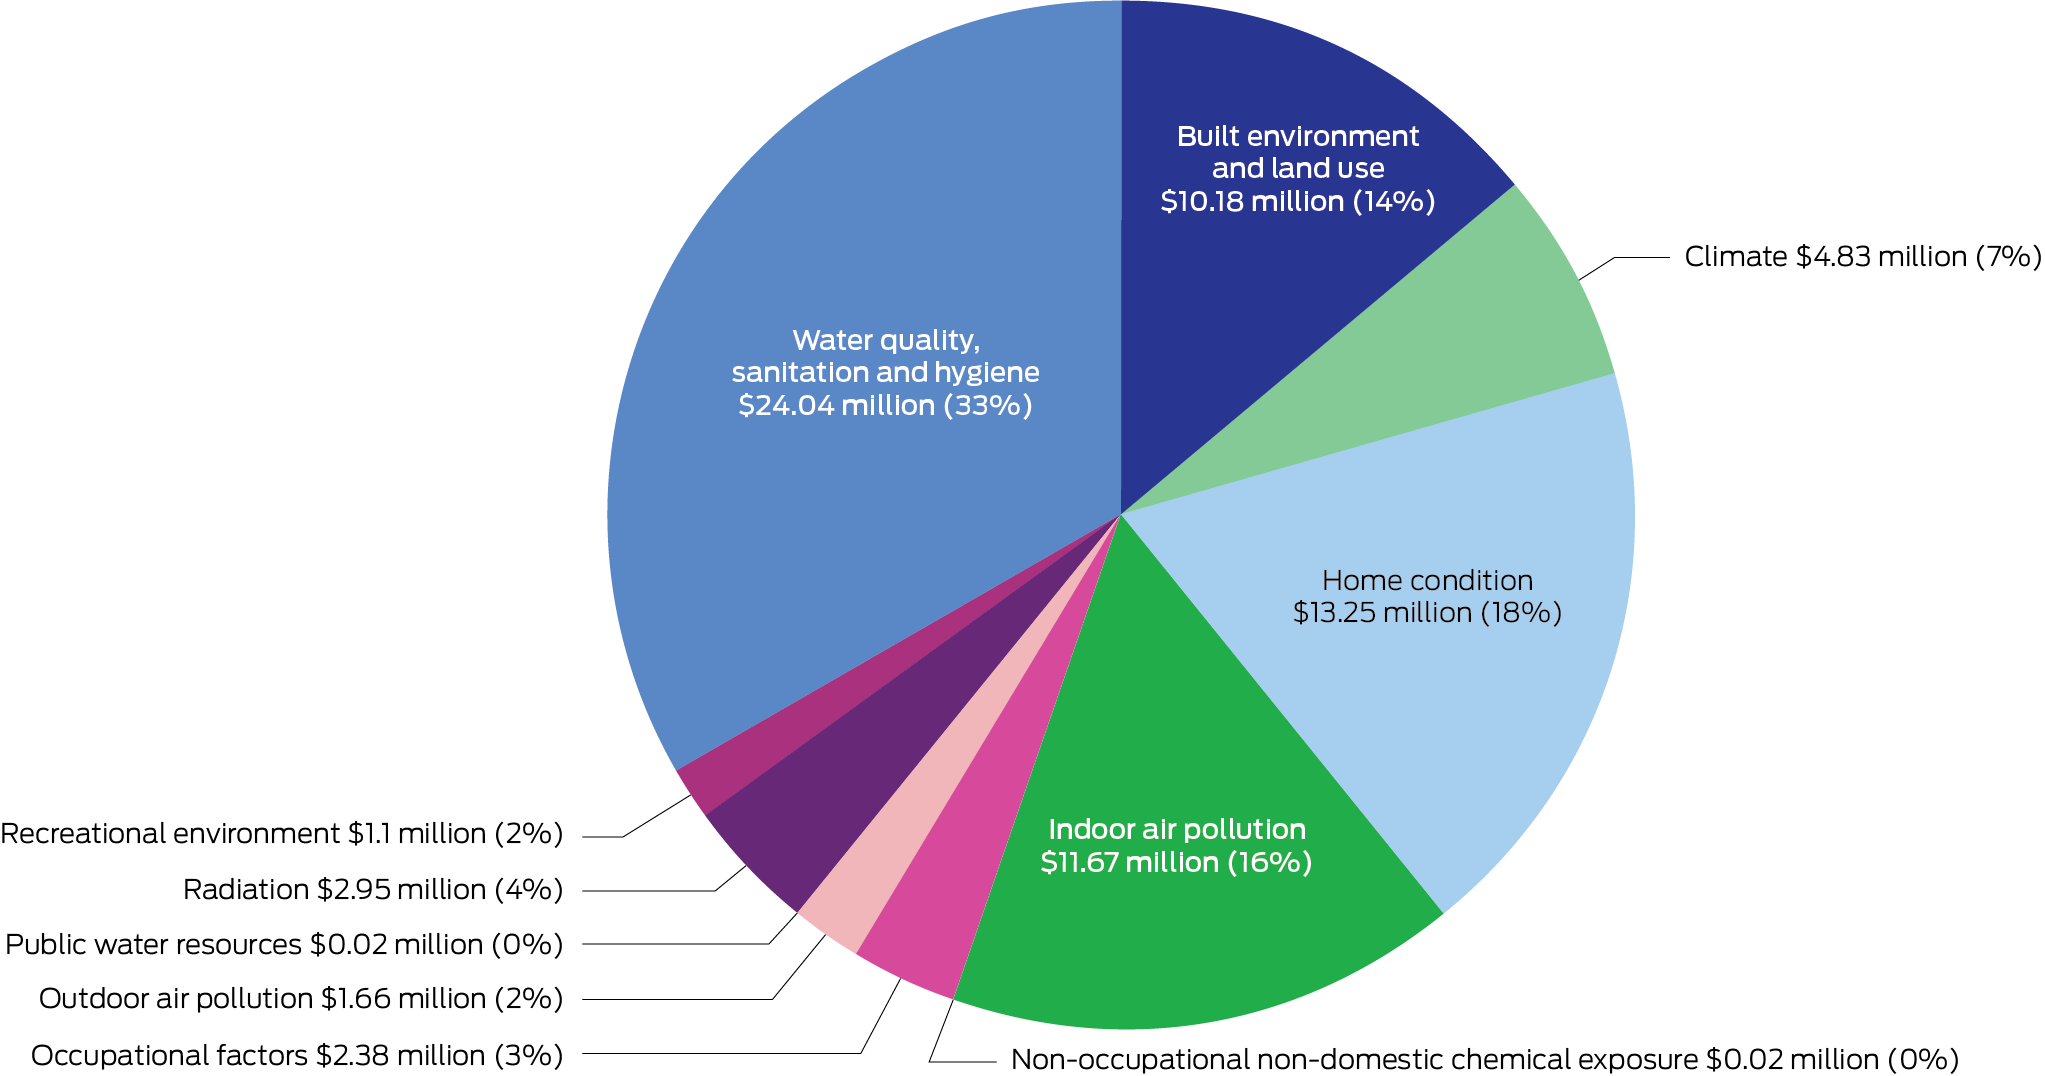
Box 5 breaks down costs by environmental risk category. Each category represents a different area of preventable environmental risk and potential area for intervention, and the corresponding figures denote the amount of money spent on hospital separations attributable to each category. The highest contributor is “water quality, sanitation and hygiene”, contributing over $24 million — about one‐third of the total cost. Other important risks include “home condition” ($13 million, 18% of total cost), followed by “indoor air pollution” and “built environment and land use”.
Discussion
Environmental risk factors contributed $72 075 766 to hospitalisation costs in the NT in the 2021–22 financial year; there is a substantial economic impact of environmental risk on human health, the health care system and public finances. As an estimate of modifiable environmental risks, this figure quantifies the potential economic burden that could be prevented through environmental interventions. Redirecting resources to cost‐effective disease prevention strategies and reducing environmental risks has been shown to not only improve health outcomes, but also lead to savings in health care.6 The data support the argument that the environment should be recognised as a key factor for health protection, and prioritised in primordial and primary prevention initiatives.
We found a disproportionate impact of environmental health risks among children, among Indigenous people and in remote areas. A global analysis has also found that children younger than 5 years are most affected by the environment, and that environmental health risks are distributed unequally within countries, with disparities along urban–rural and income gradients.6 Indigenous peoples have long recognised the role of environmental conditions in shaping health and wellbeing, and the ongoing impacts of colonisation continue to adversely and inequitably affect both the physical and social environments in which many Indigenous people live.21,22 Recent policy developments, such as the National Aboriginal and Torres Strait Islander Health Plan 2021–2031, now explicitly acknowledge environmental health as a key determinant, reflecting the leadership and advocacy of Indigenous communities.4 Environmental health risks are closely tied to other social determinants of health. Many risks, such as inadequate water and sanitation, disproportionately affect those living in remote areas, in inadequate housing, and with lower incomes.6 In the NT, 74.6% of the Indigenous population lived in remote or very remote areas in 2021, much higher than Western Australia’s 33.2%, the next highest jurisdiction.20 These determinants of health are complex, interrelated and mutually reinforcing. Mitigating these risks is important in closing health gaps.
Skin infections, including abscesses and cellulitis, constitute the largest contribution by a single disease to the environmentally attributable cost on the health system. Notably, skin infection can lead to important sequelae such as poststreptococcal glomerulonephritis, acute rheumatic fever and rheumatic heart disease, especially among Aboriginal children, who, in the NT, face one of the highest rates of acute rheumatic fever globally.23 Environmental factors such as household crowding, housing design and poor hygiene conditions have been linked to skin disease in the NT.9,23 These risks tend to decrease with reductions in poverty.6 Respiratory infections, the next highest contributor to cost, are associated with air pollution, second‐hand tobacco smoke and housing‐related risks such as crowding globally.24 For children in the NT, respiratory infections have been linked to the functional condition of houses.1
Many environmental interventions affect multiple diseases at once; for example, adequate handwashing with soap has been shown to reduce the prevalence of pneumonia, diarrhoea and impetigo.25 Given that water quality, sanitation and hygiene factors contribute more than one‐third of all environmentally attributable inpatient costs, prioritising this key area may reduce disease burden. Globally, interventions that improved water quality, sanitation and hygiene have been cost‐effective, with a return on a US$1 investment ranging from US$5 to US$46.26 Although multiple projects have aimed to address water quality, sanitation and hygiene in remote Australian communities, implementation in the NT has often lacked sustainability and long term impact.27,28 These initiatives have typically been led by non‐Indigenous entities without full codesign, limiting community ownership and relevance. Persistent barriers — such as short term funding, fragmented governance and exclusion of Aboriginal and Torres Strait Islander leadership — have undermined progress.16,27 However, a shift in power is underway, illustrated by the “global first” Australian acute rheumatic fever and rheumatic heart disease strategy (RHD Endgame) led by the Aboriginal community‐controlled health sector.29 This process aligns with the four priority reforms of the National Agreement on Closing the Gap. As a signatory, NT Health has demonstrated commitment to these by meaningful governance partnerships in key strategic documents.30,31
Addressing issues related to home condition, which contribute 18% of the total cost of hospital separations, requires targeted housing improvement programs. In an NT study, 89% of houses surveyed in ten remote Indigenous communities in 2008 needed major or urgent repair, with study participants facing a constant medium to high infection risk from environmental factors.32 An evaluation of a government‐led survey‐and‐fix program showed a 40% reduction in infectious disease hospitalisations and an increased number of homes meeting healthy living priorities in Aboriginal communities in New South Wales.21 However, systemic lack of maintenance kept baseline housing conditions unchanged long term.
In New Zealand, a healthy homes initiative composed of referrals, housing assessments and facilitated housing interventions reduced hospitalisations by 19%.33 A referral‐and‐outreach system has also been recommended by the national Expert Reference Panel on Aboriginal and Torres Strait Islander Environmental Health.34
Aboriginal and Torres Strait Islander environmental health officers and Aboriginal and Torres Strait Islander environmental health workers have distinct but complementary roles that pursue healthier environments in communities. Officers typically have university‐level qualifications and regulatory functions, while workers undergo certificate‐level training and provide health promotion and community education, though there are challenges around role clarity.35 When community‐led and appropriately supported, environmental health workers have the potential to challenge the legacy of colonisation by embedding culturally safe and community‐driven approaches to improving health outcomes. In line with Closing the Gap Priority Reforms, the NT government and the Aboriginal Medical Services Alliance Northern Territory plan to pilot an Indigenous environmental health workforce, aiming for a sustainable workforce across the territory in the long term; in addition, development of a national roadmap for an Aboriginal and Torres Strait Islander environmental health workforce is currently being led by the National Aboriginal Community Controlled Health Organisation.5,36,37
NTEAF methods may be repeated over time as part of ongoing monitoring of environmental health and health worker programs for inpatient separations. It is feasible to replicate this approach at a local hospital level within the NT for local monitoring purposes, and there may be value in future subgroup analyses to distinguish housing‐related environmental determinants from others. We especially support the adoption of the NTEAFs and associated costing data by the community‐controlled sector for their advocacy efforts, in accordance with Priority Reform 4 (Ensuring Aboriginal and Torres Strait Islander people have access to, and the capability to use, locally relevant data and information to monitor the implementation of the Priority Reforms, the closing the gap targets, and drive their own development).38
Multisectoral collaboration is needed for sustainable action on environmental risks. Key groups include the Aboriginal community‐controlled sector, and the housing and education sectors. Fostering partnerships and working together on environmental risks means resources and expertise can be pooled to maximise the impact of interventions aimed at preventing disease and saving public money.
Limitations
The estimated cost of environmentally attributable separations likely underestimates the true cost for several reasons. This study only considered separations if their primary diagnosis was environmentally attributable. Separations in which patients had a secondary, tertiary or additional supplementary diagnosis that was environmentally attributable, but lacked an environmentally attributable primary one, were excluded. In addition, the expert panel excluded mental health and cancer diagnoses from the NTEAF list, due to challenges in rigorously estimating their environmentally attributable fractions in the NT context, though they contribute appreciably to burden of disease.39 The impact of environmental changes on diseases not included in the NTEAF list was not assessed, despite emerging evidence that rising temperatures are increasingly linked to hospitalisations in many chronic diseases, including renal and cardiac disease.40,41 Another limitation arises from the fact that the evidence on which the environmentally attributable fractions is based varies in strength across risk factors and diseases, ranging from comparative risk assessment analyses to surveys of expert opinion. Potential biases exist due to reliance on expert opinion. Further, this study only examined inpatient separations, and excluded outpatient, emergency department and primary care presentation costs. This means the full cost to the government is underestimated. Finally, it is also important to note that COVID‐19 was categorised under “throat infection”, based on committee and panel input, but classification as a lower respiratory tract infection may also be appropriate.
Conclusion
We estimate that environmental risk factors contributed more than $72 million to hospital separation costs in the NT in a 1‐year period. Our findings underscore the importance of prioritising the creation and maintenance of healthy environments as a key principle of public health and health protection. Delivering on existing commitments to environmental health through meaningful partnerships and coordinated action across sectors such as housing and education is essential, particularly within the Northern Territory Implementation Plan on Closing the Gap.42
Box 1 – Overview of separations and costs attributable to environmental risk in Northern Territory public hospitals, July 2021 – June 2022
|
|
Hospital separation or cost data |
||||||||||||||
|
|
|||||||||||||||
|
Total number of separations attributable to environmental risk |
12 150 |
||||||||||||||
|
Total number of patients with separation attributable to environmental risk |
9000 |
||||||||||||||
|
Total cost attributable to environmental risk |
$72 075 766 |
||||||||||||||
|
Number (%) of separations attributable to environmental risk |
12 274*/174 195† (7%) |
||||||||||||||
|
Cost attributable to environmental risk (% of total cost) |
$71 693 279*/$860 848 839† (8%) |
||||||||||||||
|
Number (%) of patients admitted with an environmentally attributable primary diagnosis |
9000‡/42 473§ (21%) |
||||||||||||||
|
Number (%) of patients with repeat admissions |
1924¶/9000** (21%) |
||||||||||||||
|
|
|||||||||||||||
|
* Environmentally attributable separations. † Total number of separations. ‡ Environmentally attributable patients. § All patients. ¶ Patients with repeat presentations. ** Total number of patients. |
|||||||||||||||
Box 2 – Top ten environmentally attributable diseases that contributed to separations and costs in Northern Territory public hospitals, July 2021 – June 2022
|
|
Hospital separations |
Hospital costs |
|||||||||||||
|
|
Disease |
Number |
Disease |
Cost ($) |
|||||||||||
|
|
|||||||||||||||
|
1 |
Skin infection |
3028 |
Skin infection |
26 389 800 |
|||||||||||
|
2 |
Lower respiratory tract infection |
2570 |
Lower respiratory tract infection |
13 122 527 |
|||||||||||
|
3 |
Chronic lung disease |
1271 |
Cardiac (excluding rheumatic heart disease) |
9 764 956 |
|||||||||||
|
4 |
Cardiac (excluding rheumatic heart disease) |
968 |
Low birth weight |
4 271 469 |
|||||||||||
|
5 |
Diarrhoeal diseases |
752 |
Diarrhoeal diseases |
3 558 796 |
|||||||||||
|
6 |
Urinary tract infection |
554 |
Skin cancer |
2 772 893 |
|||||||||||
|
7 |
Asthma |
460 |
Acute rheumatic fever |
2 039 295 |
|||||||||||
|
8 |
Low birth weight |
437 |
Dental |
1 800 556 |
|||||||||||
|
9 |
Dental |
405 |
Chronic lung disease |
1 406 629 |
|||||||||||
|
10 |
Skin cancer |
371 |
Otitis media |
1 150 182 |
|||||||||||
|
|
|||||||||||||||
|
|
|||||||||||||||
Box 3 – Environmentally attributable costs of hospital separations by age group, sex and Indigenous status ($)
|
|
Indigenous |
Non‐Indigenous |
|
||||||||||||
|
Age group (years) |
Female |
Male |
Other |
Total |
Female |
Male |
Other |
Total |
Total |
||||||
|
|
|||||||||||||||
|
0–4 |
3 672 306 |
4 508 420 |
39 |
8 180 764 |
1 166 390 |
1 584 906 |
0 |
2 751 296 |
10 932 060 |
||||||
|
5–9 |
1 431 670 |
1 509 081 |
0 |
2 940 751 |
153 505 |
214 332 |
0 |
367 837 |
3 308 588 |
||||||
|
10–14 |
705 570 |
1 125 833 |
0 |
1 831 403 |
129 634 |
165 230 |
0 |
294 864 |
2 126 267 |
||||||
|
15–19 |
1 162 527 |
522 849 |
0 |
1 685 376 |
188 475 |
273 659 |
0 |
462 134 |
2 147 510 |
||||||
|
20–24 |
715 816 |
492 382 |
0 |
1 208 198 |
157 329 |
298 229 |
0 |
455 558 |
1 663 757 |
||||||
|
25–29 |
1 027 979 |
646 477 |
4142 |
1 678 599 |
220 998 |
290 460 |
109 |
511 567 |
2 190 165 |
||||||
|
30–34 |
1 314 462 |
1 437 356 |
0 |
2 751 818 |
293 837 |
434 176 |
0 |
728 014 |
3 479 832 |
||||||
|
35–39 |
2 240 674 |
954 255 |
1877 |
3 196 806 |
316 124 |
608 955 |
0 |
925 079 |
4 121 885 |
||||||
|
40–44 |
1 941 090 |
1 339 651 |
0 |
3 280 740 |
300 024 |
502 505 |
0 |
802 529 |
4 083 270 |
||||||
|
45–49 |
2 916 636 |
1 902 161 |
37 511 |
4 856 308 |
266 658 |
767 883 |
0 |
1 034 541 |
5 890 849 |
||||||
|
50–54 |
3 034 273 |
1 759 974 |
0 |
4 794 246 |
457 529 |
1 222 508 |
0 |
1 680 037 |
6 474 283 |
||||||
|
55–59 |
1 846 612 |
1 743 219 |
0 |
3 589 831 |
703 801 |
1 398 396 |
0 |
2 102 197 |
5 692 028 |
||||||
|
60–64 |
1 634 374 |
1 459 864 |
0 |
3 094 237 |
773 085 |
2 214 977 |
0 |
2 988 062 |
6 082 299 |
||||||
|
65–69 |
914 597 |
850 793 |
0 |
1 765 390 |
807 732 |
1 758 165 |
7622 |
2 573 518 |
4 338 908 |
||||||
|
70–74 |
757 996 |
515 656 |
0 |
1 273 653 |
675 556 |
2 015 216 |
0 |
2 690 772 |
3 964 425 |
||||||
|
75–79 |
289 141 |
253 061 |
0 |
542 202 |
540 192 |
1 330 452 |
0 |
1 870 644 |
2 412 845 |
||||||
|
80–84 |
189 044 |
230 903 |
0 |
419 946 |
346 182 |
1 074 879 |
0 |
1 421 061 |
1 841 007 |
||||||
|
≥ 85 |
61 795 |
70 974 |
0 |
132 767 |
588 892 |
589 870 |
0 |
1 178 763 |
1 311 530 |
||||||
|
Total |
25 856 559 |
21 322 909 |
43 569 |
47 223 038 |
8 085 943 |
16 744 796 |
7731 |
24 838 471 |
72 061 508 |
||||||
|
|
|||||||||||||||
|
Data have been rounded to the nearest whole number. Totals have been calculated based on decimal places, then rounded to the nearest whole number. |
|||||||||||||||
Received 10 February 2025, accepted 18 June 2025
- Geetanjali Lamba1
- Danielle Esler2
- Yuejen Zhao1
- Tracy Ward1
- Christine Connors1
- Michael Spry (Marranunggu)1
- 1 Northern Territory Department of Health, Darwin, NT
- 2 Belmont University, Nashville (TN), United States
Open access:
Open access publishing facilitated by Charles Darwin University, as part of the Wiley – Charles Darwin University agreement via the Council of Australian University Librarians.
Data Sharing:
Deidentified data underlying this study may be available on reasonable request and will be considered on a case‐by‐case basis. Interested parties may contact the corresponding author to discuss.
We extend our gratitude to the Financial Modelling and Analysis team at NT Health for providing costing data for each inpatient episode. We are also very thankful to Iris Raye and Lisa Fereday, members of the Indigenous Steering Committee who were involved with this project, for their contributions and cultural guidance, which enriched the depth and relevance of our study. We also acknowledge Yashdeep Srivastava and Nicola Slavin for their contributions as members of the expert advisory panel.
All authors either are currently or have been previously employed by NT Health. They currently receive or have previously received a salary from NT Health.
Author contributions:
Lamba G: Conceptualization, data curation, formal analysis, investigation, methodology, writing – original draft, writing – review and editing. Esler D: Conceptualization, supervision, writing – review and editing. Zhao Y: Conceptualization, data curation, methodology, writing – review and editing. Ward T: Conceptualization, investigation, methodology, writing – review and editing. Connors C: Conceptualization, resources, supervision. Spry M: Conceptualization, data curation, investigation, project administration, writing – review and editing.
- 1. Bailie R, Stevens M, McDonald E, et al. Exploring cross‐sectional associations between common childhood illness, housing and social conditions in remote Australian Aboriginal communities. BMC Public Health 2010; 10: 147.
- 2. NT Health. NT Health Strategic Plan 2023–2028: great health for all Territorians. Darwin: NT Health, 2025 https://health.nt.gov.au/__data/assets/pdf_file/0015/1206510/nt‐health‐strategic‐plan‐2023‐2028.pdf (viewed Aug 2025).
- 3. Sector strengthening plan: health. Canberra: Department of Health, 2021 https://www.closingthegap.gov.au/sites/default/files/2021‐12/sector‐strengthening‐plan‐health_2.pdf (viewed May 2025).
- 4. Australian Government Department of Health. National Aboriginal and Torres Strait Islander Health Plan 2021–2031. Canberra: Department of Health, 2021 https://www.health.gov.au/sites/default/files/2025‐01/national‐aboriginal‐and‐torres‐strait‐islander‐health‐plan‐2021‐2031_0.pdf (viewed May 2025).
- 5. National Agreement on Closing the Gap. 2020. https://www.closingthegap.gov.au/national‐agreement (viewed May 2025).
- 6. Prüss‐Üstün A, Corvalán CF; World Health Organization. Preventing disease through healthy environments: towards an estimate of the environmental burden of disease. Geneva: WHO, 2006. https://iris.who.int/handle/10665/43457 (viewed May 2025).
- 7. Murray CJL, Aravkin AY, Zheng P, et al. GBD 2019 Risk Factors Collaborators. Global burden of 87 risk factors in 204 countries and territories, 1990–2019: a systematic analysis for the Global Burden of Disease Study 2019. Lancet 2020; 396: 1223‐1249.
- 8. Australian Institute of Health and Welfare, National Indigenous Australians Agency. Acute rheumatic fever and rheumatic heart disease. In: Aboriginal and Torres Strait Islander Health Performance Framework. Canberra: Australian Government, 2014. https://www.indigenoushpf.gov.au/measures/1‐06‐rheumatic‐fever‐rheumatic‐heart‐disease (viewed May 2025).
- 9. Coffey PM, Ralph AP, Krause VL. The role of social determinants of health in the risk and prevention of group A streptococcal infection, acute rheumatic fever and rheumatic heart disease: a systematic review. PLoS Negl Trop Dis 2018; 12: e0006577.
- 10. McMullen C, Eastwood A, Ward J. Environmental attributable fractions in remote Australia: the potential of a new approach for local public health action. Aust N Z J Public Health 2016; 40: 174‐180.
- 11. Collins DJ, Lapsley HM. The avoidable costs of alcohol abuse in Australia and the potential benefits of effective policies to reduce the social costs of alcohol. National Drug Strategy (Monograph Series No. 70). Canberra: Australian Government Department of Health and Ageing, 2008. https://web.archive.org.au/awa/20091024130009mp_/http://www.nationaldrugstrategy.gov.au/internet/drugstrategy/publishing.nsf/content/0A14D387E42AA201CA2574B3000028A8/$File/mono70.pdf (viewed May 2025).
- 12. Crosland P, Ananthapavan J, Davison J, et al. The economic cost of preventable disease in Australia: a systematic review of estimates and methods. Aust N Z J Public Health 2019; 43: 484‐495.
- 13. Zhao Y, Raymond K, Chondur R, et al. Costs and benefits of community water fluoridation in remote Aboriginal communities of the Northern Territory. Aust J Rural Health 2023; 31: 1017‐1026.
- 14. von Elm E, Altman DG, Egger M; STROBE Initiative. The Strengthening the Reporting of Observational Studies in Epidemiology (STROBE) statement: guidelines for reporting observational studies. J Clin Epidemiol 2008; 61: 344‐349.
- 15. Australian Bureau of Statistics. Australian Statistical Geography Standard (ASGS) edition 3. Canberra: ABS, 2021. https://www.abs.gov.au/statistics/standards/australian‐statistical‐geography‐standard‐asgs‐edition‐3/latest‐release (viewed May 2025).
- 16. Foster T, Dance B, Willetts J. Unfinished business: water, sanitation and hygiene in remote Indigenous communities in Australia’s Northern Territory [abstract]. Water and Health Conference, 2017. Chapel Hill (USA), 16–20 October 2017. Water Institute, University of North Carolina, 2017. https://app.box.com/s/mbu96vtqi1826nxc7wsxvmlx6jvshk87 (viewed May 2025).
- 17. Independent Health and Aged Care Pricing Authority. National Hospital Cost Data Collection (NHCDC) public sector 2022–23. Canberra: IHACPA, 2023. https://www.ihacpa.gov.au/resources/national‐hospital‐cost‐data‐collection‐nhcdc‐public‐sector‐2022‐23 (viewed May 2025).
- 18. Maiam nayri Wingara Indigenous Data Sovereignty Collective, Australian Indigenous Governance Institute. Indigenous data sovereignty communique. Indigenous Data Sovereignty Summit, Canberra (Australia), 20 June 2018. https://static1.squarespace.com/static/5b3043afb40b9d20411f3512/t/63ed934fe861fa061ebb9202/1676514134724/Communique‐Indigenous‐Data‐Sovereignty‐Summit.pdf (viewed May 2025).
- 19. Mohamed J, Matthews V, Bainbridge R, Williams M. Who is speaking for us? Identifying Aboriginal and Torres Strait Islander scholarship in health research [letter]. Med J Aust 2021; 215: 383‐383.e1. https://www.mja.com.au/journal/2021/215/8/who‐speaking‐us‐identifying‐aboriginal‐and‐torres‐strait‐islander‐scholarship
- 20. Department of Treasury and Finance, Northern Territory Government. Population. In: Northern Territory Economy. Darwin: Northern Territory Government, 2024. https://nteconomy.nt.gov.au/population (viewed May 2025).
- 21. Standen JC, Morgan GG, Sowerbutts T, et al. Prioritising housing maintenance to improve health in Indigenous communities in NSW over 20 years. Int J Environ Res Public Health 2020; 17: 5946.
- 22. Hall NL, Memmott P, Barnes S, et al. Pilyii papulu purrukaj‐ji (Good housing to prevent sickness): a study of housing, crowding and hygiene‐related infectious diseases in the Barkly Region, Northern Territory. Brisbane: University of Queensland, 2020. https://www.nintione.com.au/resources/nol/pilyii‐papulu‐purrukaj‐ji‐good‐housing‐to‐prevent‐sickness‐a‐study‐of‐housing‐crowding‐and‐hygiene‐related‐infectious‐diseases‐in‐the‐barkly‐region‐northern‐territory (viewed May 2025).
- 23. Bailie RS, Stevens MR, McDonald E, et al. Skin infection, housing and social circumstances in children living in remote Indigenous communities: testing conceptual and methodological approaches. BMC Public Health 2005; 5: 128.
- 24. Kamis C, Stolte A, West JS, et al. Overcrowding and COVID‐19 mortality across US counties: are disparities growing over time? SSM Popul Health 2021; 15: 100845.
- 25. Luby SP, Agboatwalla M, Feikin DR, et al. Effect of handwashing on child health: a randomised controlled trial. Lancet 2005; 366: 225‐233.
- 26. Hutton G, Haller L, Bartram J. Global cost–benefit analysis of water supply and sanitation interventions. J Water Health 2007; 5: 481‐502.
- 27. McDonald E, Cunningham T, Slavin N. Evaluating a handwashing with soap program in Australian remote Aboriginal communities: a pre and post intervention study design. BMC Public Health 2015; 15: 1188.
- 28. Wyber R, Noonan K, Halkon C, et al. Ending rheumatic heart disease in Australia: the evidence for a new approach. Med J Aust 2020; 213 (10 Suppl): S3. https://www.mja.com.au/system/files/2020‐11/MJA%20213_10_16%20Nov%20Supp_Telethon.pdf
- 29. Casey D, Turner P. Australia’s rheumatic fever strategy three years on. Med J Aust 2024; 220: 170‐171. https://www.mja.com.au/journal/2024/220/4/australias‐rheumatic‐fever‐strategy‐three‐years
- 30. Northern Territory Government. Healthy, well and thriving – the Northern Territory’s prevention and early intervention framework for chronic conditions 2024–2030. Darwin: Northern Territory Government, 2024. https://health.nt.gov.au/__data/assets/pdf_file/0007/1405564/healthy‐well‐and‐thriving‐2024‐2030.pdf (viewed May 2025).
- 31. Northern Territory Primary Health Network, NT Health, Aboriginal Medical Services Alliance Northern Territory, Australian Government National Indigenous Australians Agency. Northern Territory Mental Health and Wellbeing Plan for Integration and Co‐Investment 2024–29. Darwin: Northern Territory Government, 2024. https://health.nt.gov.au/__data/assets/pdf_file/0008/1509029/nt‐mental‐health‐and‐wellbeing‐plan‐for‐integration‐and‐co‐investment‐2024‐29.pdf (viewed May 2025).
- 32. Bailie RS, McDonald EL, Stevens M, et al. Evaluation of an Australian indigenous housing programme: community level impact on crowding, infrastructure function and hygiene. J Epidemiol Community Health 2011; 65: 432‐437.
- 33. Pierse N, Johnson E, Thakurta AG. Healthy Homes Initiative: five year outcomes evaluation. Wellington: Health New Zealand – Te Whatu Ora, 2024. https://apo.org.au/node/329203 (viewed May 2025).
- 34. Expert Reference Panel on Aboriginal and Torres Strait Islander Environmental Health (ERPATSIEH). Expert Reference Panel on Aboriginal and Torres Strait Islander Environmental Health Action Plan 2018–2023. 2018. https://www.health.gov.au/sites/default/files/documents/2022/07/environmental‐health‐standing‐committee‐enhealth‐work‐plan‐2020‐2023_0.docx (viewed Oct 2024).
- 35. Clark D. Environmental health officers’ understanding about an Aboriginal environmental health worker program in the Northern Territory. Aust N Z J Public Health 1999; 23: 93‐94.
- 36. Aboriginal Medical Services Alliance Northern Territory. Annual report 2023–2024. 2024. https://www.amsant.org.au/wp‐content/uploads/2024/12/DIGITAL‐FINAL‐AMSANT‐Annual‐Report‐2023‐2024_compressed.pdf (viewed May 2025).
- 37. National Aboriginal Community Controlled Health Organisation. Environmental health workforce workshop report. 2022. https://www.naccho.org.au/wp‐content/uploads/2024/10/NACCHO‐NATSIEH‐Workshop‐Report‐Final‐25‐November‐2022.pdf (viewed May 2025).
- 38. Coalition of Peaks. Priority Reforms. https://static1.squarespace.com/static/62ebb08a9ffa427423c18724/t/6447c956dfcdde4ca67ab069/1682426231173/Priority‐Reforms.pdf (viewed Aug 2025).
- 39. Zhao Y, Chondur R, Li S, Burgess P. Mortality burden of disease and injury in the Northern Territory 1999–2018. Darwin: Department of Health, Northern Territory, 2022. https://health.nt.gov.au/__data/assets/pdf_file/0008/1149461/Mortality‐burden‐of‐disease‐and‐injury‐in‐the‐Northern‐Territory‐1999‐2018.pdf (viewed May 2025).
- 40. Talukder MR, Islam MT, Mathew S, et al. The effect of ambient temperatures on hospital admissions for kidney diseases in Central Australia. Environ Res 2024; 259: 119502.
- 41. Webb L, Bambrick H, Tait P, et al. Effect of ambient temperature on Australian Northern Territory public hospital admissions for cardiovascular disease among Indigenous and non‐Indigenous populations. Int J Environ Res Public Health 2014; 11: 1942‐1959.
- 42. Local Government Association of the Northern Territory, Aboriginal Peak Organisations Northern Territory, Northern Territory Government. Closing the Gap – Northern Territory Implementation Plan. 2021. https://aboriginalaffairs.nt.gov.au/__data/assets/pdf_file/0008/1039814/closing‐the‐gap‐implementation‐plan‐web.pdf (viewed May 2025).
Abstract
Objectives: To quantify the cost of hospital separations attributable to environmental risk factors in the Northern Territory, including for Indigenous and remote subgroups.
Study design: A retrospective cross‐sectional secondary data analysis of hospital separations data. Data collection, analysis and presentation were guided by our Indigenous Steering Committee.
Setting and participants: All episodes of care from 1 July 2021 to 30 June 2022 with an inpatient separation (discharge, transfer, death) from NT public hospitals were included. Non‐inpatient episodes of care (outpatient, emergency department and primary care presentations) were excluded.
Major outcome measures: Individual hospital separations were classified as environmentally attributable if the International statistical classification of diseases and related health problems, 10th revision, Australian modification (ICD‐10‐AM) code for their primary diagnosis matched an included disease. Included diseases were based on environmental attributable fractions previously generated for the Kimberley region, contextualised to the NT. Costs were assigned to individual hospital separations based on activity‐based funding allocations.
Results: Environmental risk factors contributed more than $72 million to inpatient hospital costs in the NT over 1 year. Environmental risks disproportionately affected children aged 0–4 years ($10.9 million), Indigenous people ($47.2 million) and those in remote areas ($41.7 million). Skin disease made up the largest contribution by a single disease ($26.4 million). The two largest categories of environmental risk were “water quality, sanitation and hygiene” and “home condition”, together contributing $37.3 million in costs.
Conclusions: Quantifying the economic impact of preventable environmental risk in the NT bolsters the argument for strengthening environmental health initiatives. Health disparities between groups reflect the interconnectedness of environmental, social and cultural determinants of health. Targeted interventions to reduce inequities in housing, sanitation and water quality are needed. Delivering on existing environmental health commitments through meaningful partnerships and coordinated action across sectors such as housing and education is essential, particularly within the Northern Territory Implementation Plan on Closing the Gap.