


The known: Cohort studies have consistently found that adolescent vaping increases the likelihood of future smoking. However, it is not known whether these individual‐level associations have translated into changes in population‐level smoking rates among Australian adolescents.
The new: Australia's remarkable progress in reducing adolescent smoking slowed significantly from 2010 onwards, coinciding with the emergence of vaping. By 2022–2023, there were, respectively, 74, 54, 25 and 16 more 12–17‐year‐olds per 1000, and 7 more 14–15‐year‐olds per 1000, who had engaged in ever, past year, past month, past week and daily smoking than projected by smoking trajectories from the pre‐vaping era.
The implications: Integrated, comprehensive tobacco and vaping control strategies are needed to combat smoking and use of other nicotine products by young Australians.
Australia has been remarkably successful in reducing adolescent smoking rates in recent decades. From 2001 to 2022–2023, the proportion of 14–17‐year‐olds who smoked regularly decreased by 90% (from 15.4% to 1.6%), while daily smoking dropped by 86% (from 10.2% to 1.4%).1 These substantial reductions underscore the effectiveness of the country's tobacco control strategies, including being the first country to introduce plain packaging,2 substantial increases in tobacco taxes,3 strict tobacco advertising bans,4 and smoke‐free policies in public spaces.5 Notwithstanding these strategies, the Australian tobacco control landscape continues to evolve and new potential challenges have emerged.2
One such potential challenge is the emergence of consumer products containing nicotine beyond traditional tobacco, such as e‐cigarettes. In stark contrast to smoking, Australian adolescents’ use of e‐cigarettes (vaping) has rapidly increased in recent years; in 2013, lifetime (ever) e‐cigarette use was estimated at 4.3% among 12–17‐year‐olds,6 whereas by 2022–2023 it was 28.4% among 14–17‐year‐olds7 (slightly different age groups were available for comparison). This rapid increase is concerning not only because of the independent health risks associated with vaping,8 but also because there is consistent evidence from individual‐level prospective cohort studies to suggest that vaping increases the risk of future smoking among adolescents.9,10 In a 2021 systematic review, for example, a meta‐analysis of 17 cohort studies showed that people younger than 20 years who had ever used e‐cigarettes were three times as likely to subsequently start smoking compared with those who had never used e‐cigarettes.10 In the Australian context, while the link between adolescent vaping and smoking is yet to be investigated in a prospective cohort study, our recent retrospective analysis showed that the rate of smoking initiation for Australians aged 12–17 years who had vaped was nearly five times that for those who had never vaped.11
Given this consistent evidence from individual‐level studies, it might be expected that Australia's progress in reducing adolescent smoking would have slowed since the emergence of vaping. This hypothesis, to our knowledge, has not previously been examined via a population‐level trend analysis. To address this gap, we analysed publicly available data from the Australian Secondary Students’ Alcohol and Drug Survey (ASSAD) from 1999 to 2023,12,13,14,15 using an interrupted time series approach. This approach, employed similarly by studies in other countries and regions,16,17,18,19,20 allowed us to compare adolescent smoking trends in Australia before and after the emergence of vaping to evaluate its potential impacts on smoking behaviour.
Methods
Study design and participants
ASSAD was launched in 1984; it involves repeated cross‐sectional surveys of 12–17‐year‐old secondary students and was conducted triennially up until 2017.12,13 The schedule was postponed in 2020 due to the coronavirus disease 2019 (COVID‐19) pandemic, resulting in the most recent survey being carried out over two calendar years, from March 2022 to July 2023 (referred to as 2022–2023 hereafter). For the current analyses, we used publicly available population‐level weighted prevalence data from the eight ASSAD surveys from 1999 to 2022–2023, and data on the affordability of factory‐made and roll‐your‐own cigarettes15 for students aged 12–17 years (used in sensitivity analyses to assess whether our findings were affected by cigarette affordability). Data collection for ASSAD was conducted with the approval of Cancer Council Victoria's Human Research Ethics Committee (HREC 1013). Since our study was a secondary analysis of publicly available population‐level data, it did not require direct ethics approval.
Measures
Students were categorised as ever smoked or ever vaped based on whether they had ever tried smoking or vaping. Past year, past month, past week and daily smoking were defined by reported use within those respective time frames; daily smoking referred to smoking every day in the past week. Daily smoking data were only complete from 1999 to 2022–2023 for 14–15‐year‐olds for all (self‐reported) genders combined.14 Therefore, our analysis of daily smoking is limited to this category.
Statistical methods
Weighted prevalence refers to smoking and vaping prevalence estimates weighted for location (state or territory), sex, age and education sector, using post‐stratification weights based on inverse probability of selection to match the national student population.13 Interrupted time series analyses were conducted using segmented logistic regression21,22 to assess whether the rates of decline in the weighted prevalence of the five publicly available smoking outcomes — ever, past year, past month, past week and daily smoking — changed since the year e‐cigarettes started being used at noticeable levels across Australia. This year is termed the change‐year in the regression models, but choosing the most appropriate change‐year is not straightforward. This is because Australia, like many countries, only began surveying adolescents about vaping after e‐cigarette use had already started to emerge. Specifically, the first large national survey to collect data on adolescent vaping was the National Drug Strategy Household Survey (NDSHS) in 2013; it showed that 4.3% of 12–17‐year‐olds had already tried an e‐cigarette.6 Given the lack of vaping prevalence estimates in Australia before 2013, we selected 2010 as the change‐year for our primary analysis based on trends in countries such as the United States and regions in the United Kingdom, where adolescent vaping started to reach noticeable levels around 2010–201123,24 (although we also varied the change‐year, using each year from 2008 to 2014, in sensitivity analyses). For each of the five smoking prevalence outcomes, the segmented logistic regression models were specified as:
logit (weighted‐smoking‐prevalenceyear) = α + β1background‐trendyear + β2vaping‐trendyear
With weighted‐smoking‐prevalenceyear incorporated in the model using nyear/Nyear, where Nyear is the unweighted sample size for that year, and nyear was calculated by multiplying the weighted prevalence by Nyear; background‐trendyear = 1999, 2002, 2005, 2008, 2011, 2014, 2017, and 2022.5, corresponding to the ASSAD survey years (and with 2022.5 corresponding to 2022–2023); and vaping‐trendyear coded as 0 before 2011, then 2 for 2011, 5 for 2014, 8 for 2017, and 13.5 for 2022–2023. Because there was no survey in 2010, 2011 was coded as 2 to correspond to the second year of potential change in the observed trend. This coding method effectively sets 2010 as the change‐year through interpolation, despite the absence of direct data from that year. In the models, 1999 was chosen as the model start‐year since smoking prevalence only began declining consistently for all five smoking outcomes from this year onwards, thereby providing a more representative pre‐vaping baseline than if earlier years were included.
Smoothed smoking prevalence estimates (reported as percentages) for 1999 to 2022–2023 were calculated using model‐estimated values. The background trend represents estimates with the vaping‐trend parameter (β2) set to 0, projecting the pre‐2010 smoking trend forward as if vaping had no influence on smoking rates. The observed trend represents estimates with all model parameters, reflecting the actual smoking trend observed from 2010 onwards, including the effects of vaping. Smoothed background and observed smoking prevalence estimates (reported as percentages) for 2022–2023 are denoted B23 and O23, respectively. Excess numbers of students in 2022–2023 who experienced each smoking outcome per 1000 students due to changes in the observed trend at the change‐year were calculated as E23 = 10 × (O23‐B23) (with the potential for negative values to correspond to fewer students experiencing the smoking outcome). From the models, eβ2 represents the odds ratio (OR) corresponding to the change in smoking trend at the change‐year (denoted ORβ2 hereafter), with values > 1 and < 1 indicating a slowing or acceleration in the rate of decline in smoking, respectively.
To check for autocorrelation, linear regressions were performed with the same covariate specification as used in the logistic models, but with weighted prevalence converted to log odds as the model outcomes, to facilitate Breusch–Godfrey tests of first order autocorrelation in the residuals. Where significant autocorrelation was identified, heteroskedasticity‐ and autocorrelation‐consistent (HAC) standard errors were used; in its absence, model‐based standard errors were used. Methods for the supplementary and sensitivity analyses are in the Supporting Information.
Results
A total of 172 406 secondary school students aged 12–17 years were included in the analyses (Box 1), with 82 903 (48%) identifying as male and 89 224 (52%) as female. Of the 10 314 students who participated in 2022–2023, 279 (3%) were categorised as other or not stated for the gender item (which included non‐binary).
The weighted prevalence of ever vaping increased slightly from 13.2% in 2014 to 13.5% in 2017, before rapidly increasing to 29.9% in 2022–2023, a 2.3‐fold increase over the 9‐year period (Box 2). Past month vaping prevalence increased from 3.3% in 2014 to 4.2% in 2017, and then increased to 15.7% in 2022–2023, corresponding to a 4.8‐fold increase over the 9‐year period.
In 1999, 52.7% of 12–17‐year‐old students had ever tried smoking, 37.8% had smoked in the past year, 23.4% in the past month, 19.2% in the past week, and 7.3% of 14–15‐year‐old students smoked daily (Box 3, weighted prevalence data points). By 2022–2023, these prevalences had declined considerably to 13.5%, 8.2%, 3.4%, 2.1% and 0.8%, respectively. These changes represent relative declines of 74.4% for ever smoking, 78.3% for past year smoking, 85.5% for past month smoking, 89.1% for past week smoking and 89.0% for daily smoking.
The interrupted time series analyses indicated significant changes in smoking prevalence trends from the change‐year (2010) onwards (Box 3 and Supporting Information, table 1). The Breusch–Godfrey test result was significant for daily smoking only (Supporting Information, table 2), hence HAC standard errors were used for models with daily smoking as the outcome. For ever smoking (Box 3, panel A), the slope of the smoothed observed prevalence trend deviated upwards significantly from the projected background trend in 2010 (P < 0.001 for ORβ2 = 1.07 v 1.00). This deviation indicates a significant change in the linear trends of the log‐odds of ever smoking (with linearity attributable to the logit transformation used in logistic regression). By 2022–2023, the estimated prevalence of ever smoking was 13.2% (95% CI, 12.7–13.6) based on the smoothed observed trend, compared with 5.8% (95% CI, 5.6–6.0) for the projected background trend in the hypothetical absence of vaping. This amounts to 74 (95% CI, 67–80) more 12–17‐year‐olds per 1000 in 2022–2023 who had tried smoking than expected if ever smoking rates had continued along the pre‐vaping era trajectory.
As with ever smoking, the observed trends for the four other smoking outcomes — past year smoking (Box 3, panel B), past month smoking (Box 3, panel C), past week smoking (Box 3, panel D) and daily smoking (Box 3, panel E) — also significantly deviated upward from the projected background trends (P < 0.001 for ORβ2 = 1.06 v 1.00 for all of these outcomes). These slowing rates of decline translate to respective excesses of 54 (95% CI, 48–60), 25 (95% CI, 21–29) and 16 (95% CI, 12–19) 12–17‐year‐olds per 1000, and 7 (95% CI, 4–9) 14–15‐year‐olds per 1000, smoking in the past year, past month, past week and daily in 2022–2023 than expected if pre‐vaping trajectories had continued.
Additional data are shown in the Supporting Information: sensitivity analyses varying the change‐year (table 1), assuming a survey design effect of 6 (table 3), and applying HAC standard errors to all smoking outcomes (table 4) did not materially alter our main findings. Gender‐specific estimates for ever and past year smoking showing significant interaction effects are presented in figure 1 and figure 2. Figure 3 shows trends in cigarette affordability. Adjusted models accounting for cigarette affordability (figure 4) and estimates excluding 2022–23 data to account for potential COVID‐19‐related distortions and/or recent increases in illicit cigarette availability (figure 5) also produced findings consistent with the main analysis.
Discussion
From 1999 to 2022–2023, Australia experienced substantial declines in the prevalence of ever, past year, past month and past week smoking among 12–17‐year‐old students, and daily smoking among 14–15‐year‐old students, with reductions ranging between 74% and 89% across these five smoking outcomes. However, while these declines mark a significant achievement for tobacco control in Australia, the overall picture is not entirely positive. Specifically, our analysis also showed that the rates of decline in each of these five smoking outcomes slowed significantly from around 2010 onwards, coinciding with the emergence of vaping among Australian adolescents. In this context, the mixed nature of our findings — with both encouraging and discouraging elements — suggests that while historic tobacco control measures like taxation, smoke‐free legislation and plain packaging have yielded remarkable public health gains in Australia, the emergence of e‐cigarettes may have subtly undermined these measures.
Our population‐level findings are consistent with the strong positive association between adolescent vaping and future smoking identified in our previous retrospective cohort study — to our knowledge, the only Australian individual‐level study to assess this issue to date.11 In addition, our findings are consistent with similar strong positive associations identified almost universally in prospective cohort studies,9,10 a study type often regarded as the gold standard in observational research.25,26 Despite the alignment between our population‐level findings and those from individual‐level studies, interrupted time series analyses from other countries have not always shown similar alignments. For instance, in the 2021 meta‐analysis of 17 cohort studies mentioned earlier,10 all seven studies from the United States reported significant positive associations between adolescent vaping and future smoking, whereas a 2019 interrupted time series analysis observed that smoking rates among US youth appeared to have accelerated in their decline from 2014 (their change‐year).17 Discrepancies between study types, such as this, have led some to argue that individual‐level cohort studies may not be adequately controlling for “common liabilities” associated with vaping and smoking (such as individual predispositions to risk‐taking behaviour) and that this might be confounding the observed relationships between adolescent vaping and future smoking.27 This argument has persisted even though multiple previous cohort studies adjusted for a wide range of confounders, including various common liabilities, and were judged to be of high quality9 and/or have low risk of bias.10
Another possible explanation for discrepancies between study types could be that population‐level trend analyses, including ours, are inherently limited in their ability to control for confounders. As a result, if the strong potential confounders of tobacco affordability and other tobacco control measures are not controlled for, they could easily overshadow the effects of vaping on smoking rates. Confounding due to tobacco affordability was a possibility in four of the five interrupted time series studies mentioned earlier,16,17,18,19 which did not control for tobacco affordability, tobacco price or other tobacco control measures. In a sensitivity analysis, we adjusted for the affordability of factory‐made cigarettes and the relative affordability difference between roll‐your‐own and factory‐made cigarettes for 12–17‐year‐olds (Supporting Information, figure 4). The results were similar to those in the main analysis, suggesting that, at least in the context of our Australian data, affordability dynamics were not an important confounding factor.
With regard to potential confounding from tobacco control measures not related to affordability, it is important to recognise the cumulative nature of many important measures in Australia over the study period. Important measures implemented before the 2010 change‐year, such as the 2006 adoption of pictorial health warnings on cigarette packs28 and the enforcement of smoking bans in enclosed public spaces across various states,5 remained in effect and likely continued to exert their influence after 2010. These measures were then augmented by additional measures after 2010, such as plain packaging in 20122 and extensions of smoke‐free areas in public places.5 Significantly, none of these important measures were reversed, and although government spending on tobacco control interventions such as media campaigns has fluctuated,29 the overall trajectory of tobacco control in Australia is one of cumulative strengthening. Consequently, it is plausible that if it were not for the accumulating nature of tobacco control measures over time, the slowing in the rates of decline in smoking that we observed from 2010 may have been even greater.
One recent study that did attempt to account for affordability, by incorporating inflation‐adjusted cigarette prices, was our similar interrupted time series analysis of smoking prevalence among New Zealand adolescents from 1999 to 2023, which also used 2010 as the change‐year.20 Although comparisons between our New Zealand and Australian findings are complicated by differences in age groups (the New Zealand data pertain exclusively to 14–15‐year‐olds, while the Australian data mainly relate to 12–17‐year‐olds), such comparisons are somewhat informative because smoking and vaping outcomes were defined in similar ways, thereby allowing comparisons of ever, regular (past month in ASSAD) and daily use. For regular vaping, the prevalence among New Zealand 14–15‐year‐olds in 2023 (16.4%) was similar to that observed among Australian 12–17‐year‐olds in 2022–2023 (15.7%). Correspondingly, both countries experienced significant slowing in the rates of decline in ever and regular smoking from 2010 onwards, coinciding with the emergence of vaping. While the estimated excess numbers for ever and past month smoking were slightly higher in Australia in 2022–2023 (74 and 25 per 1000, respectively) than in New Zealand in 2023 (60 and 12 per 1000, respectively), small differences such as these are difficult to interpret. They may reflect effect modification due to different age ranges, differences in methods, or differences in broader contextual factors. What is important, however, is that in both settings, the direction and timing of the smoking trend changes align with the emergence of e‐cigarettes in a way that seems unlikely to be merely coincidental.
An exception to the similarities between countries lies in the observed trends in daily smoking among 14–15‐year‐olds. In New Zealand, there was no significant change in the rate of decline in daily smoking following the emergence of vaping, whereas in Australia the decline slowed (albeit by a small amount in absolute terms).20 The reasons for this divergence are unclear, as little is known about how adolescent vaping might affect daily smoking. Unlike less frequent smoking, few individual‐level studies and no meta‐analyses have focused on adolescent daily smoking as an outcome, likely due to its rarity (eg, only 1.2% of New Zealand's 2023 sample and 0.8% of Australia's 2022–2023 sample). Although speculative, one possible explanation for the difference between countries might be that adolescents who vape daily are less likely to progress to daily smoking compared with those who vape regularly, but not on a daily basis. In this regard, the substantial time, effort and financial costs associated with maintaining both daily vaping and daily smoking as dual habits may make progression from daily vaping to daily smoking unlikely — potentially resulting in little or no net effect — compared with progression from non‐daily vaping to daily smoking. The available data provide some support for this hypothesis. Regular vaping was more common among New Zealand 14–15‐year‐olds in 2022 (16.4%) than their Australian counterparts in 2022–2023 (13.1%), driven by more daily vaping among New Zealand adolescents (10.0% versus 2.8%). On the other hand, removing daily vaping from regular vaping (ie, 16.4% minus 10.0% for New Zealand and 13.1% minus 2.8% for Australia) reveals a higher proportion of regular non‐daily vaping among Australian 14–15‐year‐olds (10.3%) compared with their New Zealand peers (6.4%). This raises the possibility that, despite more daily vaping among New Zealand 14–15‐year‐olds, it may be the higher rate of regular non‐daily vaping among Australian 14–15‐year‐olds that has facilitated greater progression to daily smoking.
Another notable aspect of our results was the significantly greater slowing in the decline of ever smoking and past month smoking among females compared with males (Supporting Information, figure 1 and figure 2). If vaping is positively associated with future smoking among Australian 12–17‐year‐olds, as suggested by findings from our previous retrospective cohort study,11 then the observed greater slowing in decline of smoking among 12–17‐year‐old females in the current study is consistent with their higher incidence rate ratio (IRR) for smoking attributable to vaping observed in the retrospective cohort study (IRR = 5.4 for females versus IRR = 4.0 for males). However, when comparing changes in smoking trends across groups such as males and females, it is important to consider not only the strength and direction of the association between vaping and smoking, but also the prevalence of vaping in each group. In the current study, the available gender‐specific vaping prevalence data present a mixed picture. In 2022–2023, vaping prevalence was considerably higher among females than males for both ever vaping (35.4% v 25.1%) and past month vaping (19.2% v 12.6%) (Box 2), which — like the gender‐specific IRRs — is consistent with the observed greater slowing in decline of smoking among females. However, in earlier years, females had lower vaping prevalences compared with males: in 2014, ever vaping was 10.5% among females versus 15.9% among males, and past month vaping was 2.2% versus 4.4%. Similarly, in 2017, prevalences of ever vaping and past month vaping were 9.7% and 3.0% for females, respectively, compared with 17.2% and 5.5% for males. When averaged across all three periods, however, vaping prevalences were broadly similar for males and females (for ever vaping, 19.4% for males and 18.5% for females; for past month vaping, 7.5% for males and 8.1% for females). Thus, overall, the similar average vaping prevalences between genders combined with the higher IRR for females is broadly consistent with the observed greater slowing in decline of smoking for females. Nevertheless, caution is warranted when interpreting these gender‐specific results. While comparisons across groups can offer insights, they are inherently limited when such groups are defined by factors likely to be associated with vaping and/or smoking, such as gender or age. In this regard, it is important to acknowledge that our study design was not a quasi‐natural experiment enabling the use of a difference‐in‐differences approach,22,30 which can reliably compare changes in trends across comparator groups when key assumptions about such groups are fulfilled.
In addition to the limitations discussed above, our analysis has other limitations. Although our model estimates generally align well with the data — with weighted prevalence estimates following the smoothed observed trends closely — there are two notable exceptions. For past month and past week smoking, the 2022–2023 weighted prevalence estimates sit well below the observed smoothed estimates (Box 3, panels C and D). However, while these discrepancies suggest a degree of unexplained variation in the models, it is noteworthy that when we adjusted for the affordability of factory‐made cigarettes and the relative affordability difference between roll‐your‐own and factory‐made cigarettes for 12–17‐year‐olds, the 2022–2023 model estimates aligned well with the data (Supporting Information, figure 4). This suggests that the larger‐than‐expected declines in past week and past month smoking in 2022–2023 appear to be largely explained by affordability dynamics, noting that 2022–2023 had the lowest affordability for both factory‐made and roll‐your‐own cigarettes, and also the smallest relative affordability difference between products (meaning there was less incentive to engage in product substitution). Another potential limitation of our analysis is that it relied on a dataset with only eight time points. While it has been suggested that a low number of time points in an interrupted time series analysis limits statistical power, results from a recent study indicate that this limitation can be overcome by large sample sizes.31 In this context, the substantial sample sizes before and after the change‐year, together with the highly statistically significant effect estimates that we observed for all five smoking outcomes, suggest that our analysis is unlikely to have been underpowered. Lastly, although not a limitation, it could be wrongly assumed that the slowing declines in smoking prevalence that we observed are due to natural slowing as prevalence approaches zero. However, logistic regression inherently accounts for this natural slowing over time via its asymptotic sigmoid‐shaped curve. In other words, the slowing that we observed was above and beyond what is expected from natural slowing. This feature is one of the many reasons why the interrupted time series approach using segmented logistic regression is a well established method for analysing binary outcomes over time,21,22 and has been employed in other interrupted time series studies of smoking trends.18,19,20
To our knowledge, our study is the first to analyse Australian population‐level trends to assess whether the rates of decline in adolescent smoking rates changed following the emergence of vaping in Australia around 2010. We observed significant slowing in the pre‐existing rates of decline for five key smoking outcomes, coinciding with the emergence of vaping. While acknowledging the inherent limitations of population‐level trend analysis, our findings, when viewed alongside consistent findings from individual‐level studies, bolster the evidence of a link between vaping and future smoking among Australian adolescents. This potential link highlights the complexity of tobacco control in the current landscape, where nicotine‐containing products like e‐cigarettes appear to have dampened the progress that might have otherwise been achieved through tobacco control strategies. Moreover, this potential link underscores the need for fully integrated strategies that address both smoking and use of other nicotine products by young Australians.
Box 1 – Students included in the study: 12–17‐year‐old participants of the Australian Secondary Students’ Alcohol and Drug Survey by gender, survey year and age
|
|
Gender |
|
|||||||||||||
|
Characteristic |
Male, n (row %) |
Female, n (row %) |
Other or not stated, n (row %)* |
Total, n (column %) |
|||||||||||
|
|
|||||||||||||||
|
Total |
82 903 (48%) |
89 224 (52%) |
279 (< 1%) |
172 406 |
|||||||||||
|
Survey year |
|
|
|
|
|||||||||||
|
1999 |
12 544 (49%) |
12 942 (51%) |
— |
25 486 (15%) |
|||||||||||
|
2002 |
11 646 (50%) |
11 771 (50%) |
— |
23 417 (14%) |
|||||||||||
|
2005 |
10 162 (47%) |
11 643 (53%) |
— |
21 805 (13%) |
|||||||||||
|
2008 |
11 491 (47%) |
12 917 (53%) |
— |
24 408 (14%) |
|||||||||||
|
2011 |
11 741 (47%) |
13 113 (53%) |
— |
24 854 (14%) |
|||||||||||
|
2014 |
10 994 (48%) |
12 013 (52%) |
— |
23 007 (13%) |
|||||||||||
|
2017 |
8891 (47%) |
10 224 (53%) |
— |
19 115 (11%) |
|||||||||||
|
2022–2023 |
5434 (53%) |
4601 (45%) |
279 (3%) |
10 314 (6%) |
|||||||||||
|
Age (years) |
|
|
|
|
|||||||||||
|
12 |
8724 (47%) |
9744 (53%) |
34 (< 1%) |
18 502 (11%) |
|||||||||||
|
13 |
16 149 (49%) |
16 721 (51%) |
58 (< 1%) |
32 928 (19%) |
|||||||||||
|
14 |
16 302 (49%) |
16 711 (51%) |
48 (< 1%) |
33 061 (19%) |
|||||||||||
|
15 |
15 684 (50%) |
15 844 (50%) |
53 (< 1%) |
31 581 (18%) |
|||||||||||
|
16 |
15 319 (46%) |
17 627 (53%) |
57 (< 1%) |
33 003 (19%) |
|||||||||||
|
17 |
10 725 (46%) |
12 577 (54%) |
29 (< 1%) |
23 331 (14%) |
|||||||||||
|
|
|||||||||||||||
|
*Other or not stated was not available as a response option for gender before 2022–2023. |
|||||||||||||||
Box 2 – Weighted vaping prevalence among Australian secondary school students by survey year and gender*
|
|
Male |
Female |
All† |
||||||||||||
|
E‐cigarette use |
Unweighted number of participants |
Weighted prevalance |
Unweighted number of participants |
Weighted prevalance |
Unweighted number of participants |
Weighted prevalance |
|||||||||
|
|
|||||||||||||||
|
12–17‐year‐olds |
|
|
|
|
|
|
|||||||||
|
Ever vaping |
|
|
|
|
|
|
|||||||||
|
2014 |
10 994 |
15.9% |
12 013 |
10.5% |
23 007 |
13.2% |
|||||||||
|
2017 |
8891 |
17.2% |
10 224 |
9.7% |
19 115 |
13.5% |
|||||||||
|
2022–2023 |
5434 |
25.1% |
4601 |
35.4% |
10 314 |
29.9% |
|||||||||
|
Past month vaping |
|
|
|
|
|
|
|||||||||
|
2014 |
10 994 |
4.4% |
12 013 |
2.2% |
23 007 |
3.3% |
|||||||||
|
2017 |
8891 |
5.5% |
10 224 |
3.0% |
19 115 |
4.2% |
|||||||||
|
2022–2023 |
5434 |
12.6% |
4601 |
19.2% |
10 314 |
15.7% |
|||||||||
|
Daily vaping |
|
|
|
|
|
|
|||||||||
|
2022–2023 |
5434 |
4.2% |
4601 |
2.1% |
10 314 |
3.0% |
|||||||||
|
14–15‐year‐olds |
|
|
|
|
|
|
|||||||||
|
Ever vaping |
|
|
|
|
|
|
|||||||||
|
2022–2023 |
— |
|
— |
|
3904 |
26.1% |
|||||||||
|
Past month vaping |
|
|
|
|
|
|
|||||||||
|
2022–2023 |
— |
|
— |
|
3904 |
13.1% |
|||||||||
|
Daily vaping |
|
|
|
|
|
|
|||||||||
|
2022–2023 |
— |
|
— |
|
3904 |
2.8% |
|||||||||
|
|
|||||||||||||||
|
*Prevalence data were only available for the years and age groups shown. †Data include students for whom gender was categorised as other or not stated. |
|||||||||||||||
Box 3 – Observed and background trends estimated from segmented logistic regression models, and weighted prevalence values, for ever smoking (A), past year smoking (B), past month smoking (C) and past week smoking (D) among 12–17‐year‐olds and daily smoking (E) among 14–15‐year‐olds*
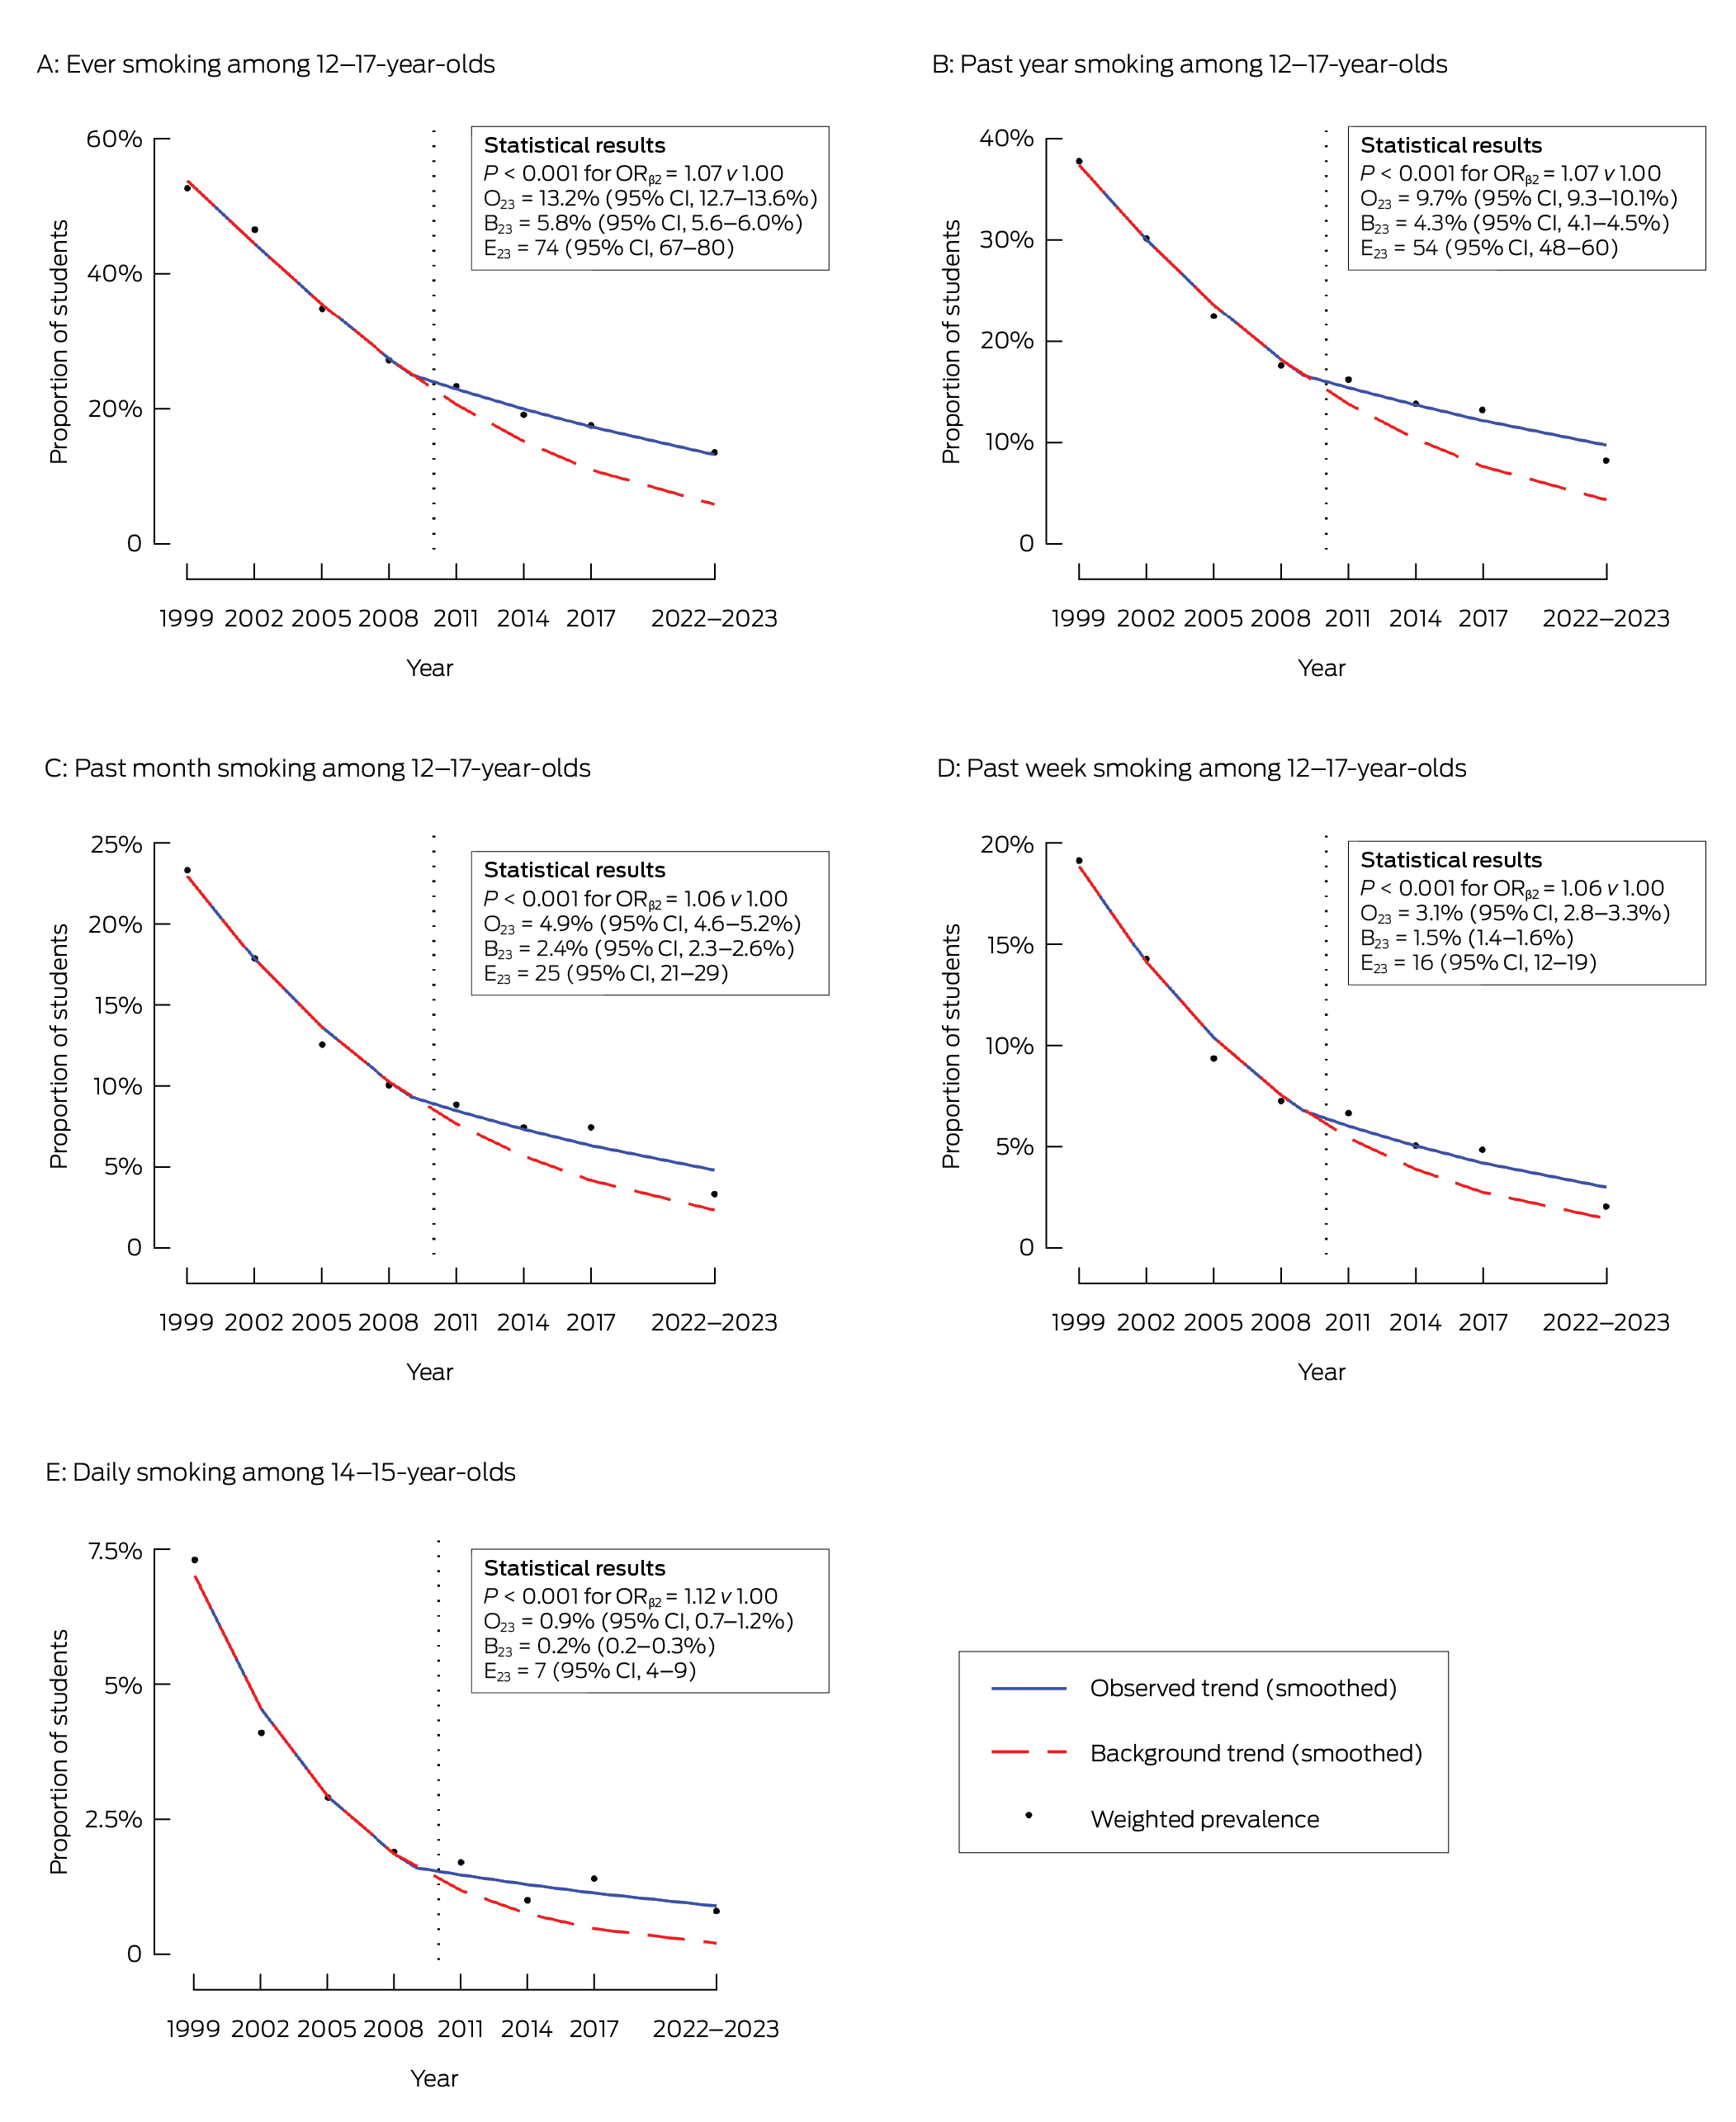
CI = confidence interval; ORβ2 = odds ratio corresponding to the change in smoking trend at the change‐year; O23 = smoothed observed smoking prevalence estimate for 2022–2023; B23 = smoothed background smoking prevalence estimate for 2022–2023; E23 = excess numbers of students in 2022–2023 who experienced the respective smoking outcome per 1000 students. * The dotted vertical lines indicate the change‐year (2010).
Received 30 January 2025, accepted 30 May 2025
- Sam J Egger1
- Michael David1
- Marianne F Weber2
- Qingwei Luo1
- Anita Dessaix3
- Becky Freeman2
- 1 Daffodil Centre, University of Sydney, Sydney, NSW
- 2 University of Sydney, Sydney, NSW
- 3 Cancer Council New South Wales, Sydney, NSW
Open access:
Open access publishing facilitated by The University of Sydney, as part of the Wiley – The University of Sydney agreement via the Council of Australian University Librarians.
Data Sharing:
All data used in the current analyses are population‐level and publicly available.
We thank Alecia Brooks, Emily Jenkinson, Ciara Madigan and the Generation Vape study team at Cancer Council NSW for their invaluable support and advice.
Sam Egger is funded by an Australian Government scholarship. Becky Freeman has received payments to her institution from Cancer Council NSW, the Medical Research Future Fund, the National Health and Medical Research Council, the Ian Potter Foundation and NSW Health. She has also received consulting fees from the World Health Organization, NSW Health, Cancer Council Australia and the Sax Institute, and payments for lectures, presentations and educational events from the Department of Health, Government of the Hong Kong Special Administrative Region. She has been reimbursed for travel expenses related to her attendance at several conferences, including the Oceania Tobacco Control Conference, the Australian Public Health Conference, the Australasian Epidemiological Association Annual Scientific Meeting and others. She has served as an unpaid expert advisor to the Cancer Council Australia's Tobacco Issues Committee, a paid expert member of the NHMRC Electronic Cigarettes Working Committee, an unpaid advisor to the Vaping Communications Advisory Panel, and an unpaid expert member of the New South Wales Chief Health Officer's E‐cigarette Expert Panel. All other authors declare no potential conflicts of interest.
Author contribution:
Egger SJ: Conceptualization, data curation, formal analysis, writing – original draft, writing – review and editing. David M: Writing – review and editing. Weber MF: Writing – review and editing. Luo Q: Writing – review and editing. Dessaix A: Writing – review and editing. Freeman B: Writing – review and editing.
- 1. Australian Institute of Health and Welfare. Data tables: National Drug Strategy Household Survey 2022–2023 – 2. Tobacco smoking. Canberra: AIHW, 2024. https://www.aihw.gov.au/reports/illicit‐use‐of‐drugs/national‐drug‐strategy‐household‐survey/data (viewed Apr 2025).
- 2. Freeman B. Reigniting tobacco control: returning Australia to the front of the pack. Public Health Res Pract 2023; 33: e3312304.
- 3. Greenhalgh EM, Scollo MM, Winstanley MH. The pricing and taxation of tobacco products in Australia. In: Greenhalgh EM, Scollo MM, Winstanley MH, editors. Tobacco in Australia: facts and issues. Melbourne: Cancer Council Victoria, 2024. https://www.tobaccoinaustralia.org.au/chapter‐13‐taxation (viewed Apr 2025).
- 4. Scollo M, Bayly M. Tobacco advertising and promotion. In: Greenhalgh EM, Scollo MM, Winstanley MH, editors. Tobacco in Australia: facts and issues. Melbourne: Cancer Council Victoria, 2024. https://www.tobaccoinaustralia.org.au/chapter‐11‐advertising (viewed Apr 2025).
- 5. Scollo M, Bayly M. Smokefree environments. In: Greenhalgh EM, Scollo MM, Winstanley MH, editors. Tobacco in Australia: facts and issues. Melbourne: Cancer Council Victoria, 2024. https://www.tobaccoinaustralia.org.au/chapter‐15‐smokefree‐environment (viewed Apr 2025).
- 6. Australian Institute of Health and Welfare. Tobacco chapter, supplementary data tables, Table 3.16. In: National Drug Strategy Household Survey 2016: detailed findings. Canberra: AIHW, 2017. https://www.aihw.gov.au/reports/illicit‐use‐of‐drugs/2016‐ndshs‐detailed/data (viewed Apr 2025).
- 7. Australian Institute of Health and Welfare. Data tables: National Drug Strategy Household Survey 2022–2023 – 3. Electronic cigarettes and vapes. Canberra: AIHW; 2024. https://www.aihw.gov.au/reports/illicit‐use‐of‐drugs/national‐drug‐strategy‐household‐survey/data (viewed Apr 2025).
- 8. Banks E, Yazidjoglou A, Brown S, et al. Electronic cigarettes and health outcomes: systematic review of global evidence. Report for the Australian Department of Health. Canberra: National Centre for Epidemiology and Population Health, 2022. https://www.nhmrc.gov.au/sites/default/files/documents/attachments/ecigarettes/Electronic_cigarettes_and_health_outcomes_%20systematic_review_of_evidence.pdf (viewed Apr 2025).
- 9. O’Brien D, Long J, Quigley J, et al. Association between electronic cigarette use and tobacco cigarette smoking initiation in adolescents: a systematic review and meta‐analysis. BMC Public Health 2021; 21: 954.
- 10. Yoong SL, Hall A, Turon H, et al. Association between electronic nicotine delivery systems and electronic non‐nicotine delivery systems with initiation of tobacco use in individuals aged < 20 years: a systematic review and meta‐analysis. PLoS One 2021; 16: e0256044.
- 11. Egger S, David M, Watts C, et al. The association between vaping and subsequent initiation of cigarette smoking in young Australians from age 12 to 17 years: a retrospective cohort analysis using cross‐sectional recall data from 5114 adolescents. Aust N Z J Public Health 2024; 10: 100173.
- 12. Scully M, Bain E, Koh I, et al. ASSAD 2022–2023: Australian secondary school students’ use of tobacco and e‐cigarettes. Melbourne: Cancer Council Victoria, 2023. https://www.health.gov.au/sites/default/files/2024‐04/australian‐secondary‐school‐students‐use‐of‐tobacco‐and‐e‐cigarettes‐2022‐2023.pdf (viewed Apr 2025).
- 13. Guerin N, White V. ASSAD 2017 statistics and trends: trends in substance use among Australian secondary students. 2nd ed. Melbourne: Cancer Council Victoria, 2020. https://www.health.gov.au/sites/default/files/documents/2020/07/trends‐in‐substance‐use‐among‐australian‐secondary‐school‐students‐1996‐2017.pdf (viewed Apr 2025).
- 14. Greenhalgh EM, Jenkins S, Bain E, Winstanley MH. 1.6 Prevalence of smoking — teenagers. In: Greenhalgh EM, Scollo MM, Winstanley MH, editors. Tobacco in Australia: facts and issues. Melbourne: Cancer Council Victoria, 2024. http://www.tobaccoinaustralia.org.au/chapter‐1‐prevalence/1‐6‐prevalence‐of‐smoking‐teenagers (viewed Apr 2025).
- 15. Bayly M, Scollo MM. 13.5 How affordable are cigarettes in Australia? In: Greenhalgh EM, Scollo MM, Winstanley MH, editors. Tobacco in Australia: facts and issues. Melbourne: Cancer Council Victoria, 2024. https://www.tobaccoinaustralia.org.au/chapter‐13‐taxation/13‐5‐how‐affordable‐are‐cigarettes‐in‐australia (viewed Apr 2025).
- 16. Dutra LM, Glantz SA. E‐cigarettes and national adolescent cigarette use: 2004–2014. Pediatrics 2017; 139: e20162450.
- 17. Levy DT, Warner KE, Cummings KM, et al. Examining the relationship of vaping to smoking initiation among US youth and young adults: a reality check. Tob Control 2019; 28: 629‐635.
- 18. Hallingberg B, Maynard OM, Bauld L, et al. Have e‐cigarettes renormalised or displaced youth smoking? Results of a segmented regression analysis of repeated cross sectional survey data in England Scotland and Wales. Tob Control 2020; 29: 207‐216.
- 19. Tattan‐Birch H, Brown J, Shahab L, et al. Trends in vaping and smoking following the rise of disposable e‐cigarettes: a repeat cross‐sectional study in England between 2016 and 2023. Lancet Reg Health Eur 2024; 42: 100924.
- 20. Egger S, David M, McCool J, et al. Trends in smoking prevalence among 14–15‐year‐old adolescents before and after the emergence of vaping in New Zealand: an interrupted time series analysis of repeated cross‐sectional data, 1999–2023. Lancet Reg Health West Pac 2025; 56: 101522.
- 21. Taljaard M, McKenzie JE, Ramsay CR, Grimshaw JM. The use of segmented regression in analysing interrupted time series studies: an example in pre‐hospital ambulance care. Implement Sci 2014; 9: 77.
- 22. Mascha EJ, Sessler DI. Segmented regression and difference‐in‐difference methods: assessing the impact of systemic changes in health care. Anesth Analg 2019; 129: 618‐633.
- 23. West R, Beard E, Brown J. Trends in electronic cigarette use in England. Smoking Toolkit Study. London: University College London, 2018. https://clivebates.com/documents/CRUKWest.pdf (viewed Apr 2025).
- 24. Cullen KA, Ambrose BK, Gentzke AS, et al. Use of electronic cigarettes and any tobacco product among middle and high school students — United States, 2011–2018. MMWR Morb Mortal Wkly Rep 2018; 67: 1276‐1277.
- 25. Thiese MS. Observational and interventional study design types; an overview. Biochem Med (Zagreb) 2014; 24: 199‐210.
- 26. Friis RH, Sellers T. Epidemiology for public health practice. Burlington, Mass: Jones & Bartlett Learning, 2020.
- 27. Mendelsohn CP, Hall W, Borland R, et al. A critique of the Australian National Health and Medical Research Council CEO statement on electronic cigarettes. Addiction 2023; 118: 1184‐1192.
- 28. Scollo M, Hippolyte D, Miller C. What has been the impact of pictorial health warnings in Australia? In: Greenhalgh EM, Scollo MM, Winstanley MH, editors. Tobacco in Australia: facts and issues. Melbourne: Cancer Council Victoria, 2019. https://www.tobaccoinaustralia.org.au/chapter‐12‐tobacco‐products/attachment‐12‐1‐health‐warnings/12a‐5‐the‐impact‐of‐graphic‐warnings‐in‐australia (viewed Apr 2025).
- 29. Grogan P, Banks E. Far from ‘mission accomplished’: time to re‐energise tobacco control in Australia. Public Health Res Pract 2020; 30: e3032016.
- 30. De Chaisemartin C, d’Haultfoeuille X. Fuzzy differences‐in‐differences. Rev Econ Stud 2018; 85: 999‐1028.
- 31. van Leeuwen FD, Lugtig P, Feskens R. The performance of interrupted time series designs with a limited number of time points: learning losses due to school closures during the COVID‐19 pandemic. PLoS One 2024; 19: e0301301.
Abstract
Objective: To compare adolescent smoking trends in Australia before and after the emergence of e‐cigarettes in about 2010, to evaluate the potential impacts of adolescent vaping on smoking prevalence.
Design: Repeated cross‐sectional study.
Setting: Australian secondary schools.
Participants: 172 406 students aged 12–17 years who took part in the Australian Secondary Students’ Alcohol and Drug Survey between 1999 and 2023.
Main outcome measures: Prevalence of ever, past year, past month and past week smoking for 12–17‐year‐olds, and daily smoking for 14–15‐year‐olds.
Results: From 2014 to 2022–2023, the prevalence of ever vaping among students increased 2.3‐fold (from 13.2% to 29.9%), while past month vaping increased 4.8‐fold (from 3.3% to 15.7%). From 1999 to 2022–2023, there were substantial declines in the prevalence of ever, past year, past month, past week and daily smoking among students, with reductions ranging between 74% and 89%. However, the rates of decline for these five measures of smoking slowed significantly from 2010 onwards, coinciding with the emergence of vaping. By 2022–2023, there were, respectively, 74 (95% confidence interval [CI], 67–80), 54 (95% CI, 48–60), 25 (95% CI, 21–29) and 16 (95% CI, 12–19) more 12–17‐year‐olds per 1000, and 7 (95% CI, 4–9) more 14–15‐year‐olds per 1000 who had engaged in ever, past year, past month, past week and daily smoking than projected by smoking trajectories from the pre‐vaping era. These findings were robust to sensitivity analyses, including the use of different time series interruption points (change‐years) and controlling for the affordability of cigarettes.
Conclusion: Australia's remarkable progress in reducing adolescent smoking has slowed since the emergence of vaping, underscoring the need for integrated tobacco and vaping control strategies.