


The known: The COVID‐19 pandemic increased the burden on health care systems. The effect of community remote patient monitoring for managing acute COVID‐19 on hospital use and patient outcomes has not been examined in Australia.
The new: Remote monitoring of people with COVID‐19, based on a smartphone application, clinical portal, and phone calls from clinicians, was associated with increased numbers of hospitalisations, but also with shorter mean length of stay and lower risk of death within 28 days of clinical onset.
The implications: Community remote monitoring of people with acute COVID‐19 is feasible and safe, and could also be used for managing other medical conditions.
The coronavirus disease 2019 (COVID‐19) pandemic, caused by the severe acute respiratory syndrome coronavirus 2 (SARS‐CoV‐2), reached Australia somewhat later than other countries.1 Clinical phenotypes ranged from asymptomatic and mild disease to fatal pneumonitis.2 In New South Wales, the waves of SARS‐CoV‐2 variants can be characterised as pre‐Delta (1 January 2020 – 15 June 2021), predominantly Delta (16 June 2021 – 14 December 2021), and predominantly Omicron (since 15 December 2021).1
In‐person consultations are the mainstay of health care in Australia. In some countries, the COVID‐19 pandemic led to the rapid implementation of new models of remote care, including telehealth monitoring.3,4 Telehealth services were introduced to manage COVID‐19 more safely in the community, reduce the numbers of emergency department presentations and hospital admissions, and minimise the associated infection transmission risk to health care workers and other people. Remote patient monitoring (RPM) was used during the first three COVID‐19 waves in Australia.5
In NSW, the South Eastern Sydney Local Health District (SESLHD) employed a care model for managing SARS‐CoV‐2‐positive people isolating at home. A preliminary study found that clinicians reviewing people in phone consultations, without monitoring vital signs, was effective and safe during the pre‐Delta period.6 At about the same time, an RPM trial for people discharged home after hospital admissions with cardiac conditions, based on a smartphone application (TeleClinical Care app) and clinician portal, was associated with clinical benefits.7 The TeleClinical Care service allowed people to submit pulse, blood pressure, weight, and symptom‐related data to a centralised clinical monitoring team. The TeleClinical Care team and the SESLHD infectious diseases team collaborated to adapt the TeleClinical Care system for remote monitoring of people with COVID‐19 (the TCC‐COVID system) (Supporting Information, parts 1 and 2).
High patient and staff satisfaction with telehealth services has been reported, and no differences in morbidity or mortality among people with chronic diseases.8,9 Virtual health care services for managing people with acute COVID‐19 in high income countries have been described,10,11 but no reported studies have examined mortality and safety outcomes or described services in Australia. We therefore evaluated the influence of RPM for managing people with acute COVID‐19 on 28‐day mortality and hospital use in the SESLHD during the Omicron wave (26 November 2021 – 30 June 2022), by which point remote care for people with COVID‐19 in NSW had moved to an opt‐in model.
Methods
We undertook a retrospective observational cohort study of all people residing in the SESLHD catchment area (468 km2, 970 000 residents) diagnosed with COVID‐19 during 26 November 2021 – 30 June 2022. The SESLHD Public Health Unit extracted COVID‐19 case data from the NSW Notifiable Conditions Information Management System. RPM data was extracted from the TCC‐COVID database; hospital, emergency department, and non‐admitted patient data were extracted from local administrative data sources. Deterministic data linkage used combinations of personal identifiers, including first name, last name, sex, date of birth, postcode, and local medical record numbers, to facilitate complete matching across data sources.
In the SESLHD, two tertiary hospitals (Prince of Wales, St George) and one major metropolitan hospital (Sutherland) provided most COVID‐19 care during the study period. We included all people aged fifteen years or older living in the SESLHD for whom positive SARS‐CoV‐2 test results (polymerase chain reaction or rapid antigen testing) during 26 November 2021 – 30 June 2022 were recorded in the NSW Notifiable Conditions Information Management System. People were categorised as receiving RPM if they were monitored with the TCC‐COVID app or by clinician phone calls, and blood oxygen saturation (using a pulse oximeter) and symptom data were collected in their homes.
Remote patient monitoring
SARS‐CoV‐2‐positive people were referred to the community management centre after completing an online survey sent by the New South Wales Ministry of Health. People who reported health concerns and opted into care were allocated to SESLHD on the Patient Flow Portal and were assessed by the clinical team to determine their risk of clinical deterioration or hospitalisation (Box 1). Following the initial assessment, people were triaged as being at low, moderate, high, or very high risk of clinical deterioration or hospitalisation (Supporting Information, part 3). People at low risk were given information about self‐management at home and about whom to contact in the event of deterioration, and were discharged from the community management centre. People at moderate risk remained in the care of the team and were offered enrolment for RPM via the TCC‐COVID app; people who could not or declined to use the app were remotely monitored via phone calls from the clinical team. People at high risk were referred to and managed by the COVID‐19 telehealth assessment clinic (CTAC) service of their local hospital and were remotely monitored via the TCC‐COVID app (if they consented) and phone calls from the CTAC.
For all eligible people enrolled for RPM, a courier delivered a pulse oximeter to measure their pulse rate and blood oxygen saturation (SpO2); people submitted pulse rate and SpO2 readings twice daily via the app or phone calls. A daily symptom assessment comprised seven outcome measures. The SESLHD RPM services operated during 08:00–20:00, seven days a week. People were advised to call a provided telephone number if they felt unwell or experienced technical problems. They were actively monitored until the clinical team informed them that they met the criteria for ending isolation, required admission to hospital, or they declined to be monitored further.
Data collection
The SESLHD TeleClinical Care trial of remote monitoring of people with cardiovascular disease used a web‐based system that comprised a clinician dashboard with data analysis features for monitoring and triaging incoming patient data, a server, and an app;7 it was designed in consultation with the NSW Ministry of Health to meet privacy and security guidelines. A version of this system was used in our study; further data were collected in electronic case report forms using the REDCap electronic data capture tool.12 Information about treatment during the trial was also recorded in patient electronic medical records.
The personal characteristics included in analyses were age, sex (male, female), Indigenous status, residential postcode‐based socio‐economic status (Index of Relative Socio‐economic Advantage and Disadvantage, IRSAD13), and other medical conditions (diabetes, hypertension, asthma, chronic obstructive pulmonary disease, interstitial lung disease, bronchiectasis, liver disease, heart disease, obesity, chronic kidney disease stage 3 or higher, immunosuppression status).
The risk of hospitalisation algorithm was developed by the NSW Ministry of Health to support enrolment for the Integrated Care for People with Chronic Conditions program, and was implemented in the patient flow portal.14 It estimates the individual likelihood of an unplanned hospitalisation within twelve months, based on socio‐demographic characteristics, health service use during the preceding four years, and an extensive list of chronic physical and mental conditions; it was used in an earlier phase of community care triage for people with COVID‐19 in NSW (Supporting Information, part 4).
Outcomes
The primary outcome was all‐cause mortality within 28 days of positive SARS‐CoV‐2 test results in the RPM and usual care groups. Secondary outcomes were hospital length of stay, and numbers of emergency department presentations, hospital admissions, and intensive care unit admissions within 14 days of positive test results.
Statistical analysis
To minimise the bias caused by potential confounders associated with assignment to models of care, we used two propensity score‐based adjustment methods: propensity score matching and inverse probability of treatment weighting. Propensity scores were estimated in a multivariate logistic regression model that included socio‐demographic factors (age, sex, Indigenous status, IRSAD quintile) and health profile (local risk of hospitalisation group, selected medical conditions) as covariates. People were matched using nearest‐neighbour matching without replacement (1:1, calliper width of 0.05). A standardised mean difference between the two groups for baseline covariates of 0.1 was deemed to indicate adequate balance. Inverse probability of treatment weighting was used to supplement propensity score matching for estimating the average treatment effect for the treated (ATT). The stable propensity score (PS) inverse weights for ATT were applied to the usual care group as PS/(1–PS).
Associations between treatment groups and outcomes was quantified in multivariate logistic regression analyses adjusted for all covariates; we report adjusted odds ratios (aOR) with 95% confidence interval (CIs). For SESLHD hospital admissions (overnight or longer) within fourteen days of a positive SARS‐CoV‐2 test result, length of stay was calculated as the number of days between admission and discharge date, excluding leave days; we report both median values with interquartile ranges (IQRs) and mean values with standard deviations. We evaluated the association of RPM with SESLHD hospital length of stay for people with COVID‐19 (overnight or longer hospital stays) within fourteen days of a positive SARS‐CoV‐2 test result in multivariate negative binomial regression analyses adjusted for all covariates; we report adjusted odds ratios (aORs) with 95% CIs. We undertook time‐to‐event analyses for the primary outcome (28‐day mortality); mortality in the two groups was compared using Kaplan–Meier analysis and the log‐rank test. Associations between covariates and 28‐day survival were evaluated using multivariate Cox proportional hazards regression analysis; we report adjusted hazard ratios (aHRs) with 95% CIs. All analyses were conducted in R 4.3.0 (R Foundation for Statistical Computing).
Ethics approval
The study design and access to clinical data was approved by the South Eastern Sydney Local Health District human research ethics committee (2022/ETH02067).
Results
During 26 November 2021 – 30 June 2022, positive SARS‐CoV‐2 test results were recorded for 326 898 people residing in the SESLHD catchment area. After excluding 48 480 people under 15 years of age, 40 because age and 178 because sex information was not available, and 1964 people for whom IRSAD could not be determined, we included data for 276 236 people in our analysis. A total of 4399 people (1.6%) participated in RPM, including 3161 who used the TCC‐COVID app (71.9%).
The proportions of people in the RPM group with certain medical conditions were larger than in the usual care group: diabetes (3.4% v 0.6%), obesity (1.7% v 0.2%), heart disease (1.9% v 0.4%), and chronic kidney disease (1.6% v 0.2%). The proportions of female participants (58.1% v 52.5%), people with high or very high risk of hospitalisation scores (22.9% v 5.0%), people aged 75 years or older (20.8% v 4.4%), and Indigenous people (3.3% v 1.1%) were also larger in the RPM than the usual care group. The proportion of people living in the top highest socio‐economic status quintile was smaller in the RPM group (39.0% v 49.6%) (Box 2). After propensity score matching or inverse probability treatment weighting, the standardised mean differences for all baseline characteristics were less than 0.1 (Supporting Information, table 1), indicating good covariate balance between the two treatment groups.
Twenty‐eight‐day mortality was lower for the RPM group than the usual care group (propensity score‐matched: aOR, 0.19; 95% CI; 0.08–0.43; inverse probability treatment‐weighted: aOR, 0.21; 95% CI, 0.10–0.46). The likelihood of intensive care unit admissions and emergency department presentations within fourteen days of a positive SARS‐CoV‐2 test result was similar for both groups. The likelihood of hospital admission was higher for the RPM group than the usual care group (propensity score‐matched: aOR, 1.42; 95% CI, 1.12–1.78; inverse probability treatment‐weighted: aOR, 1.51; 95% CI, 1.28–1.78) (Box 3).
In the original cohort analysis, the median length of stay was three days (interquartile range [IQR], 2–7 days) in the RPM group and five days (IQR, 2–11 days) in the usual care group (Box 4). The adjusted mean difference in length of stay was –2.01 (95% CI, –2.81 to –1.21) days (propensity score‐matched: –3.54 [95% CI, –6.39 to –0.69] days; inverse probability treatment‐weighted: –3.26 [95% CI, –6.01 to –0.50] days) (Box 5).
After propensity score matching or inverse probability treatment weighting, unadjusted Kaplan–Meier survival analysis indicated that 28‐day survival was higher for people remotely monitored than for those who received usual care (log‐rank test: P < 0.001) (Box 6). In multivariate Cox model analyses, 28‐day risk of death was lower (propensity score‐matched: HR, 0.19; 95% CI, 0.09–0.44; inverse probability treatment‐weighted: aHR, 0.20; 95% CI; 0.09–0.42) (Box 7).
The 28‐day risk of death was higher for Indigenous than non‐Indigenous people in the original cohort (aHR, 4.27; 95% CI, 2.01–9.05) and inverse probability treatment‐weighted analyses (aHR, 3.40; 95% CI, 1.21–9.56). The risk was higher for people aged 75 years or older than for people under 75 years in all analyses (original cohort: aHR, 81.1; 95% CI, 61.4–107; propensity score‐matched: aHR, 13.5; 95% CI, 6.26–29.2; inverse probability treatment‐weighted: aHR, 12.9; 95% CI, 7.86–21.3); it was higher for men than women only in the original cohort analysis (aHR, 1.28; 95% CI, 1.04–1.58). Having two or more of the listed medical conditions was associated with higher 28‐day mortality risk in all analyses (Box 7).
Discussion
In our retrospective cohort study in the SESLHD during November 2021 – June 2022, the likelihood of death (any cause) within 28 days of positive SARS‐CoV‐2 test results was lower for people receiving RPM than for those receiving usual acute care for COVID‐19 (original cohort: aOR, 0.21; 95% CI, 0.09–0.42; propensity score‐matched: aOR, 0.19; 95% CI; 0.08–0.43), despite selection for the RPM group being based on greater risk of clinical deterioration. The likelihood of hospital admissions was higher for the RPM group (original cohort: aOR, 1.65; 95% CI, 1.40–1.94; propensity score‐matched: aOR, 1.42; 95% CI, 1.12–1.78), but the mean difference in length of stay was two days shorter for the RPM group. The odds of emergency department presentation and intensive care unit admission were similar for the two groups.
Factors associated in our study with greater likelihood of hospital use or death within 28 days of positive SARS‐CoV‐2 test results, such as more advanced age and having other medical conditions, have also been reported by other studies.15,16,17 After adjusting analyses for variables such as number of other medical conditions and socio‐economic status, we found that 28‐day mortality risk was higher for Indigenous people than other Australians. Other studies have also found that outcomes for people with COVID‐19 are poorer for those from ethnic minorities and First Nations peoples.18,19 Possible explanations include problems with access to certain services and differences in health care for particular ethnic groups because of cultural or linguistic barriers.20,21
We found that RPM was associated with greater likelihood of hospital admission. This is not unexpected, as the model of care was designed to identify early signs of clinical deterioration by monitoring physical parameters and symptoms that could prompt referral to the clinical team and a recommendation to visit an emergency department. The likelihood of emergency department presentation was similar for the two groups, but likelihood of hospital admission was greater for the RPM group, which suggests they were more unwell or admitted specifically for inpatient assessment or treatment. The mean hospital length of stay was two days shorter with RPM than with usual care.
Clinical factors that influence the risk of death for patients with COVID‐19 include body temperature and oxygen saturation during the first emergency department presentation.22,23 RPM may have led to earlier recognition and treatment of people with deteriorating conditions, resulting in more frequent hospital admissions, but also to shorter length of stay and reduced mortality. Our findings are consistent with other reports of shorter length of stay with RPM24,25,26 and lower mortality.25 Two other studies, however, reported fewer hospitalisations of remotely monitored people with COVID‐19,25,26 but the first of these studies included only people at high risk of severe disease,25 and the second included all people with COVID‐19.26 In our study, we compared outcomes for people at high risk of severe disease who were remotely monitored with those for all people with COVID‐19 who were not remotely monitored.
Limitations
Limitations inherent to our retrospective observational study design include the possibility of incomplete or inaccurate clinical documentation in the patient flow portal. Further, deterministic linkage is convenient and achieves lower linkage error rates than probabilistic linkage, but the likelihood of excluding matches between datasets because of data entry error is greater. Secondly, our datasets were limited to information about people using hospitals in a single local health district, not other health care facilities. Other potentially important factors were therefore not included in our analysis, such as disease severity, frailty, and intrinsic personal characteristics, including health‐seeking behaviours, cultural and language barriers to health care access, and health and technology literacy. Propensity score‐based adjustment cannot eliminate residual confounding by unmeasured variables, which could influence the estimated treatment effect. However, the outcomes of our unadjusted and propensity score‐adjusted analyses were similar. Propensity score matching and inverse probability treatment weighting were used to estimate average treatment effects on the treated, a measure of interest for program evaluation. However, it also limits our findings to people who meet the inclusion criteria for remote monitoring rather than all people with COVID‐19.
We did not assess COVID‐19 vaccination status or the use of active antiviral agents, each of which could reduce the incidence of hospitalisation and death. Notifications data may not have captured all COVID‐19 cases because testing capacity was restricted during some parts of the study period, which could have increased the proportion of people at high risk of serious disease in our study. As the reasons for emergency department presentations and hospital admissions were unknown, we could not determine whether RPM reduced avoidable emergency department presentations. Finally, the study was restricted to people with COVID‐19 who lived in the SESLHD catchment area or received care in SESLHD hospitals during the SARS‐CoV‐2 Omicron epidemic wave. However, our findings regarding the safety and benefits of RPM can probably be generalised to people with other diseases.
Conclusion
We report evidence for the safety and benefits of at‐home monitoring for managing people with acute COVID‐19. While RPM was associated with greater likelihood of admission to hospitals than usual care, the mean length of stay was shorter and 28‐day mortality was lower; broader use of the intervention could reduce the hospital bed demands associated with COVID‐19. Our findings support the monitoring of people isolating at home with COVID‐19 or, possibly, other conditions, including chronic heart or lung disease.4,24,25,26 Programs need to be specific for particular diseases and conditions, and focused on people at greatest risk of severe disease so that resources are directed to those who will benefit most. Targeted RPM should be considered for improving care and outcomes, and strategies for optimising the monitoring process for those with the greatest needs should be investigated.
Box 1 – The South Eastern Sydney Local Health District COVID‐19 remote patient monitoring (RPM) service algorithm
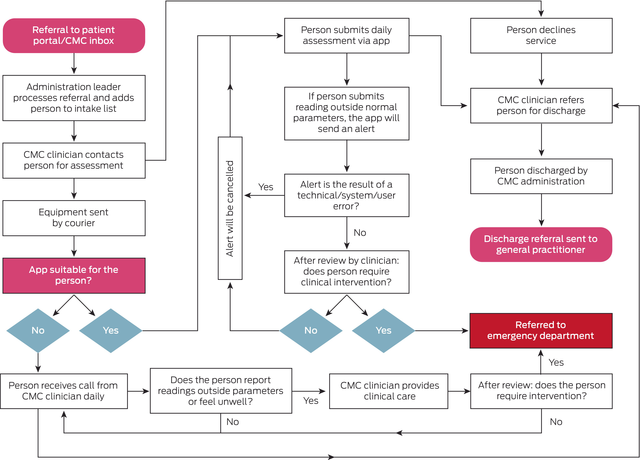
CMC = community management centre; COVID‐19 = coronavirus disease 2019.
Box 2 – Characteristics of South Eastern Sydney Local Health District residents with COVID‐19, by treatment group: unadjusted and after propensity score matching or inverse probability treatment weighting
Weighted cohorts | |||||||||||||||
Original cohort |
Propensity score‐matched |
Inverse probability treatment‐weighted | |||||||||||||
Characteristic |
Standard care |
Remote monitoring |
Standard care |
Remote monitoring |
Standard care |
Remote monitoring | |||||||||
All people |
271 837 |
4399 |
4385 |
4385 |
4419 |
4399 |
|||||||||
Age group (years) |
|||||||||||||||
15–24 |
46 980 (17.3%) |
320 (7.3%) |
321 (7.3%) |
320 (7.3%) |
320 (7.2%) |
320 (7.3%) |
|||||||||
25–34 |
70 615 (26.0%) |
636 (14.5%) |
628 (14.3%) |
636 (14.5%) |
635 (14.4%) |
636 (14.5%) |
|||||||||
35–44 |
55 925 (20.6%) |
591 (13.4%) |
594 (13.5%) |
590 (13.5%) |
589 (13.3%) |
591 (13.4%) |
|||||||||
45–54 |
41 674 (15.3%) |
562 (12.8%) |
560 (12.8%) |
561 (12.8%) |
560 (12.7%) |
562 (12.8%) |
|||||||||
55–64 |
28 283 (10.4%) |
597 (13.6%) |
592 (13.5%) |
593 (13.5%) |
597 (13.5%) |
597 (13.6%) |
|||||||||
65–74 |
16 302 (6.0%) |
777 (17.7%) |
768 (17.5%) |
773 (17.6%) |
785 (17.8%) |
777 (17.7%) |
|||||||||
75 or older |
12 058 (4.4%) |
916 (20.8%) |
922 (21.0%) |
912 (20.8%) |
933 (21.1%) |
916 (20.8%) |
|||||||||
Sex |
|||||||||||||||
Male |
129 070 (47.5%) |
1843 (41.9%) |
1843 (42.0%) |
1836 (41.9%) |
1844 (41.7%) |
1843 (41.9%) |
|||||||||
Female |
142 767 (52.5%) |
2556 (58.1%) |
2542 (58.0%) |
2549 (58.1%) |
2575 (58.3%) |
2556 (58.1%) |
|||||||||
Index of Relative Socio‐Economic Advantage and Disadvantage12 |
|||||||||||||||
Quintiles 1 to 3 |
42 830 (15.8%) |
676 (15.4%) |
674 (15.4%) |
676 (15.4%) |
678 (15.4%) |
676 (15.4%) |
|||||||||
Quintile 4 |
94 231 (34.7%) |
2009 (45.7%) |
1997 (45.5%) |
2000 (45.6%) |
2018 (45.7%) |
2009 (45.7%) |
|||||||||
Quintile 5 |
134 776 (49.6%) |
1714 (39.0%) |
1714 (39.1%) |
1709 (39.0%) |
1722 (39.0%) |
1714 (39.0%) |
|||||||||
Indigenous status |
|||||||||||||||
Non‐Indigenous |
268 885 (98.9%) |
4254 (96.7%) |
4238 (96.6%) |
4241 (96.7%) |
4272 (96.7%) |
4254 (96.7%) |
|||||||||
Indigenous |
2952 (1.1%) |
145 (3.3%) |
147 (3.4%) |
144 (3.3%) |
147 (3.3%) |
145 (3.3%) |
|||||||||
Medical conditions |
|||||||||||||||
None recorded |
266 854 (98.2%) |
3983 (90.5%) |
3989 (91.0%) |
3983 (90.8%) |
4004 (90.6%) |
3983 (90.5%) |
|||||||||
Diabetes |
1565 (0.6%) |
148 (3.4%) |
131 (3.0%) |
141 (3.2%) |
160 (3.6%) |
148 (3.4%) |
|||||||||
Asthma |
1450 (0.5%) |
114 (2.6%) |
113 (2.6%) |
108 (2.5%) |
120 (2.7%) |
114 (2.6%) |
|||||||||
Heart disease |
1143 (0.4%) |
82 (1.9%) |
79 (1.8%) |
78 (1.8%) |
85 (1.9%) |
82 (1.9%) |
|||||||||
Hypertension |
898 (0.3%) |
73 (1.7%) |
60 (1.4%) |
71 (1.6%) |
73 (1.7%) |
73 (1.7%) |
|||||||||
Obesity |
494 (0.2%) |
74 (1.7%) |
67 (1.5%) |
67 (1.5%) |
81 (1.8%) |
74 (1.7%) |
|||||||||
Chronic obstructive pulmonary disease |
464 (0.2%) |
45 (1.0%) |
40 (0.9%) |
42 (1.0%) |
47 (1.1%) |
45 (1.0%) |
|||||||||
Chronic kidney disease stage 3 or higher |
449 (0.2%) |
71 (1.6%) |
55 (1.3%) |
62 (1.4%) |
76 (1.7%) |
71 (1.6%) |
|||||||||
Liver disease |
237 (0.1%) |
11 (0.3%) |
9 (0.2%) |
11 (0.3%) |
12 (0.3%) |
11 (0.3%) |
|||||||||
Immunosuppressed |
160 (0.1%) |
42 (1.0%) |
15 (0.3%) |
33 (0.8%) |
48 (1.1%) |
42 (1.0%) |
|||||||||
Interstitial lung disease |
32 (< 0.1%) |
2 (< 0.1%) |
1 (< 0.1%) |
2 (< 0.1%) |
2 (< 0.1%) |
2 (< 0.1%) |
|||||||||
Bronchiectasis |
51 (< 0.1%) |
7 (0.2%) |
7 (0.2%) |
6 (0.1%) |
7 (0.2%) |
7 (0.2%) |
|||||||||
Local risk of hospitalisation group |
|||||||||||||||
Low risk |
210 219 (77.3%) |
2128 (48.4%) |
2115 (48.2%) |
2128 (48.5%) |
2125 (48.1%) |
2128 (48.4%) |
|||||||||
Medium risk |
48 051 (17.7%) |
1264 (28.7%) |
1263 (28.8%) |
1263 (28.8%) |
1264 (28.6%) |
1264 (28.7%) |
|||||||||
High risk |
10 208 (3.8%) |
690 (15.7%) |
690 (15.7%) |
685 (15.6%) |
700 (15.8%) |
690 (15.7%) |
|||||||||
Very high risk |
3359 (1.2%) |
317 (7.2%) |
317 (7.2%) |
309 (7.0%) |
330 (7.5%) |
317 (7.2%) |
|||||||||
COVID‐19 = coronavirus disease 2019. * The standardised mean differences for each category by treatment group are included in the Supporting Information, table 1. | |||||||||||||||
Box 3 – Comparison of clinical outcomes for people with COVID‐19 who received remote patient monitoring and those who received usual care: multivariate negative binomial regression analyses*

CI = confidence interval; COVID‐19 = coronavirus disease 2019.* Adjusted for age group, sex, Indigenous status, socio‐economic status (Index of Relative Socio‐economic Advantage and Disadvantage quintile), selected medical conditions (diabetes, hypertension, asthma, chronic obstructive pulmonary disease, interstitial lung disease, bronchiectasis, liver disease, heart disease, obesity, chronic kidney disease stage 3 or higher, immunosuppressed), and local risk of hospitalisation group. The numbers of people for each outcome by treatment group are included in the Supporting Information, table 2.
Box 4 – Median hospital length of stay for people with COVID‐19 who received remote patient monitoring and those who received usual care*
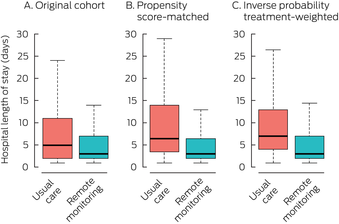
COVID‐19 = coronavirus disease 2019.* Excludes two people in the standard care group who were still in hospital at the time of data extraction. The boxplots depict the median values, interquartile ranges, and overall ranges for hospital length of stay. The data for these graphs are included in the Supporting Information, table 3.
Box 5 – Mean hospital length of stay for people with COVID‐19 who received remote patient monitoring and those who received usual care*
Mean difference (95% CI) | |||||||||||||||
Study cohort |
Standard care |
Remote monitoring |
Unadjusted |
Adjusted† | |||||||||||
Original cohort |
|||||||||||||||
Number of people |
2043 |
190 |
|||||||||||||
Hospital length of stay (days), mean (SD) |
8.9 (11.8) |
6.2 (11.6) |
–2.71 (–4.44 to –0.97) |
–2.01 (–2.81 to –1.21) |
|||||||||||
Propensity score‐matched cohort |
|||||||||||||||
Number of people |
136 |
187 |
|||||||||||||
Hospital length of stay (days), mean (SD) |
10.7 (11.7) |
6.0 (11.5) |
–4.68 (–7.25 to –2.10) |
–3.54 (–6.39 to –0.69) |
|||||||||||
Inverse probability of treatment‐weighted cohort |
|||||||||||||||
Number of people |
143 |
190 |
|||||||||||||
Hospital length of stay (days), mean (SD) |
10.6 (11.5) |
6.2 (11.6) |
–4.41 (–6.18 to –2.60) |
–3.26 (–6.01 to –0.50) |
|||||||||||
CI = confidence interval; COVID‐19 = coronavirus disease 2019; SD = standard deviation. * Excludes two people in the standard care group who were still in hospital at the time of data extraction. † Adjusted for Adjusted for age group, sex, Indigenous status, socio‐economic status (Index of Relative Socio‐economic Advantage and Disadvantage quintile), selected medical conditions (diabetes, hypertension, asthma, chronic obstructive pulmonary disease, interstitial lung disease, bronchiectasis, liver disease, heart disease, obesity, chronic kidney disease stage 3 or higher, immunosuppressed) and local risk of hospitalisation group. | |||||||||||||||
Box 6 – Survival of people with COVID‐19 from date of positive SARS‐CoV‐2 test result, by treatment group: unadjusted Kaplan–Meier analyses
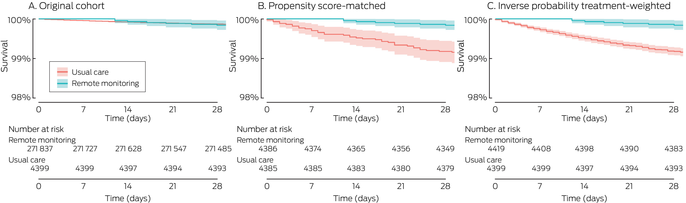
COVID‐19 = coronavirus disease 2019; SARS‐CoV‐2 = severe acute respiratory syndrome coronavirus 2.
Box 7 – Risk of death for people with COVID‐19 within 28 days of positive SARS‐CoV‐2 test result, by treatment group: multivariate Cox proportional hazards regression analyses*
Adjusted hazard ratio (95% confidence interval) | |||||||||||||||
Characteristic |
Original cohort |
Propensity score‐matched |
Inverse probability treatment‐weighted | ||||||||||||
Remotely monitored |
0.27 (0.13–0.57) |
0.19 (0.09–0.44) |
0.20 (0.09–0.42) |
||||||||||||
Aged 75 years or older |
81.1 (61.4–107) |
13.5 (6.26–29.2) |
12.9 (7.86–21.3) |
||||||||||||
Sex (male) |
1.28 (1.04–1.58) |
1.29 (0.71–2.35) |
1.35 (0.98–1.86) |
||||||||||||
Indigenous people |
4.27 (2.01–9.05) |
4.14 (0.96–17.9) |
3.40 (1.21–9.56) |
||||||||||||
Other medical conditions (v none) |
|||||||||||||||
One |
2.21 (1.55–3.14) |
2.80 (1.22–6.41) |
1.26 (0.84–1.90) |
||||||||||||
Two or more |
5.59 (4.23–7.39) |
3.62 (1.57–8.36) |
3.04 (1.95–4.72) |
||||||||||||
COVID‐19 = coronavirus disease 2019; SARS‐CoV‐2 = severe acute respiratory syndrome coronavirus 2. * Adjusted for all other variables in this table. | |||||||||||||||
Received 14 June 2024, accepted 13 December 2024
- Myong Gyu Kim1,2
- Phuong Thao Phan3
- Cambell McMaster2
- Praveen Indraratna1,2
- Jennifer Yu1,2
- Allison Martin4
- Rebecca Pinheiro3
- Lisa Altman3
- Guenter Schreier5
- Benjamin Kwan2,6
- Pamela Konecny7,8
- Jeffrey J Post1,2
- Nigel Lovell2,9
- Sze‐Yuan Ooi1,2
- Kristen Overton1,2
- 1 Prince of Wales Hospital and Community Health Services, Sydney, NSW
- 2 University of New South Wales, Sydney, NSW
- 3 South Eastern Sydney Local Health District, Sydney, NSW
- 4 The George Institute for Global Health UNSW, Sydney, NSW
- 5 Center for Health and Bioresources, Austrian Institute of Technology Graz, Austria
- 6 Sutherland Hospital, Sydney, NSW
- 7 St George Hospital, Sydney, NSW
- 8 St George Clinical School, University of New South Wales, Sydney, NSW
- 9 Tyree Institute of Health Engineering, University of New South Wales, Sydney, NSW
Open access:
Open access publishing facilitated by University of New South Wales, as part of the Wiley – University of New South Wales agreement via the Council of Australian University Librarians.
Data Sharing:
The study data can be accessed by contacting the corresponding author.
We thank the South Eastern Sydney Local Health District staff who were involved in the care of people with COVID‐19. We also thank the South Eastern Sydney Local Health District, the University of New South Wales, and the George Institute of Global Health for supporting our investigation.
Since the conduct of this published work, the technology used for remote monitoring has been commercialised by Connected Health Technologies Pty. Ltd. (trading as Apostele); Sze‐Yuan Ooi and Nigel Lovell are founding directors of this company.
- 1. Australian Institute of Health and Welfare. COVID‐19. 16 July 2024. https://www.aihw.gov.au/reports/australias‐health/covid‐19 (viewed Feb 2024).
- 2. Stokes EK, Zambrano LD, Anderson KN, et al. Coronavirus disease 2019 case surveillance: United States, January 22 – May 30, 2020. MMWR Morb Mortal Wkly Rep 2020; 69: 759.
- 3. Dosaj A, Thiyagarajan D, ter Haar C, et al. Rapid implementation of telehealth services during the COVID‐19 pandemic. Telemed J E Health 2020; 27: 116‐120.
- 4. Bokolo AJ. Exploring the adoption of telemedicine and virtual software for care of outpatients during and after COVID‐19 pandemic. Irish J Med Sci 2021; 190: 1‐10.
- 5. Gray K, Chapman W, Khan UR, et al. The rapid development of virtual care tools in response to COVID‐19: case studies in three Australian health services. JMIR Form Res 2022; 6: e32619.
- 6. Micallef M, Hurley S, Brell N, et al. Telehealth outpatient coronavirus disease 2019 case management at a tertiary hospital in Sydney. J Telemed Telecare 2021; 1357633X211024097.
- 7. Indraratna P, Biswas U, McVeigh J, et al. A smartphone‐based model of care to support patients with cardiac disease transitioning from hospital to the community (TeleClinical Care): pilot randomized controlled trial. JMIR Mhealth Uhealth 2022; 10: e32554.
- 8. Varney J, Weiland TJ, Jelinek G. Efficacy of hospital in the home services providing care for patients admitted from emergency departments: an integrative review. Int J Evid Based Healthc 2014; 12: 128‐141.
- 9. Bashshur RL, Shannon GW, Smith BR, et al. The empirical foundations of telemedicine interventions for chronic disease management. Telemed J E Health 2014; 20: 769‐800.
- 10. Annis T, Pleasants S, Hultman G, et al. Rapid implementation of a COVID‐19 remote patient monitoring program. J Am Med Inform Assoc 2020; 27: 1326‐1330.
- 11. Ferry OR, Moloney EC, Spratt OT, et al. A virtual ward model of care for patients with COVID‐19: Retrospective single‐center clinical study. J Med Internet Res 2021; 23: e25518.
- 12. Harris PA, Taylor R, Thielke R, et al. Research electronic data capture (REDCap): metadata‐driven methodology and workflow process for providing translational research informatics support. J Biomed Inform 2009; 42: 377‐381.
- 13. Australian Bureau of Statistics: IRSAD. In: Census of Population and Housing: Socio‐Economic Indexes for Areas (SEIFA), Australia, 2016 (2033.0.55.001). 27 Mar 2018. https://www.abs.gov.au/ausstats/abs@.nsf/Lookup/by%20Subject/2033.0.55.001~2016~Main%20Features~IRSAD~20 (viewed Jan 2024).
- 14. O’Callaghan C, Osborne J, Barr M, et al. Implementation of the Integrated Care for People with Chronic Conditions (ICPCC) program in SESLHD. Sydney: Centre for Primary Health Care and Equity,University of New South Wales, 2022. https://cphce.unsw.edu.au/sites/default/files/publication_related_files/Implementation%20of%20the%20ICPCC%20program%20in%20practice%20final%20report%202022_.pdf (viewed Jan 2024).
- 15. Djaharuddin I, Munawwarah S, Nurulita A, et al. Comorbidities and mortality in COVID‐19 patients. Gac Sanit 2021; 35 (Suppl 2): S530‐S532.
- 16. Khamis F, Memish Z, Bahrani MA, et al. Prevalence and predictors of in‐hospital mortality of patients hospitalized with COVID‐19 infection. J Infect Public Health 2021; 14: 759‐765.
- 17. Mehraeen E, Karimi A, Barzegary A, et al. Predictors of mortality in patients with COVID‐19: a systematic review. Eur J Integr Med 2020; 40: 101226.
- 18. Yashadhana A, Pollard‐Wharton N, Zwi AB, Biles B. Indigenous Australians at increased risk of COVID‐19 due to existing health and socioeconomic inequities. Lancet Reg Health West Pac 2020; 1: 100007.
- 19. El‐Khatib Z, Jacobs GB, Ikomey GM, Neogi U. The disproportionate effect of COVID‐19 mortality on ethnic minorities: genetics or health inequalities? EClinicalMedicine 2020; 23: 100430.
- 20. Marmot M, Allen J, Goldblatt P, et al. Fair society, healthy lives. The Marmot Review, Feb 2010. https://www.parliament.uk/globalassets/documents/fair‐society‐healthy‐lives‐full‐report.pdf (viewed Feb 2024).
- 21. Szczepura A. Access to health care for ethnic minority populations. Postgrad Med J 2005; 81: 141‐147.
- 22. Peckham H, de Gruijter NM, Raine C, et al. Male sex identified by global COVID‐19 meta‐analysis as a risk factor for death and ITU admission. Nat Commun 2020; 11: 6317.
- 23. Covino M, De Matteis G, Santoro M, et al. Clinical characteristics and prognostic factors in COVID‐19 patients aged ≥ 80 years. Geriatr Gerontol Int 2020; 20: 704‐708.
- 24. Patel H, Hassell A, Keniston A, Davis C. Impact of remote patient monitoring on length of stay for patients with COVID‐19. Telemed J E Health 2023; 29: 298‐303.
- 25. Haddad TC, Coffey JD, Deng Y, et al. Impact of a high‐risk, ambulatory COVID‐19 remote patient monitoring program on utilization, cost, and mortality. Mayo Clin Proc 2022; 97: 2215‐2225.
- 26. Crotty BH, Dong Y, Laud P, et al. Hospitalization outcomes among patients with COVID‐19 undergoing remote monitoring. JAMA Netw Open 2022; 5: e2221050.
Abstract
Objectives: To evaluate the influence of remote patient monitoring (RPM) for managing people with acute coronavirus disease 2019 (COVID‐19) on 28‐day mortality and hospital use in Australia.
Study design: Retrospective observational cohort study; analysis of deterministically linked NSW Notifiable Conditions Information Management System and hospital, emergency department, and non‐admitted patient data.
Setting, participants: South Eastern Sydney Local Health District catchment area residents aged 15 years or older for whom positive severe acute respiratory syndrome coronavirus 2 (SARS‐CoV‐2) test results (polymerase chain reaction or rapid antigen testing) during 26 November 2021 – 30 June 2022 were recorded.
Main outcome measures: Primary outcome: All‐cause mortality within 28 days of positive SARS‐CoV‐2 test result. Secondary outcomes: Hospital length of stay, and numbers of emergency department presentations, hospital admissions, and intensive care unit admissions within 14 days of positive test results. All analyses were undertaken for the unadjusted data (original cohort analysis) and after propensity score matching and inverse probability treatment weighting.
Results: Of 276 236 people aged 15 years or older with positive SARS‐CoV‐2 test results and complete demographic information, 4399 (1.6%) participated in RPM. Twenty‐eight‐day mortality was lower for the RPM group than the usual care group (propensity score‐matched: adjusted odds ratio [aOR], 0.19; 95% confidence interval [CI], 0.08–0.43; inverse probability treatment‐weighted: aOR, 0.21; 95% CI, 0.10–0.46). The 14‐day likelihood of intensive care unit admission and emergency department presentation was similar for both groups; the likelihood of hospital admission was higher for the RPM group (propensity score‐matched: aOR, 1.42; 95% CI, 1.12–1.78; inverse probability treatment‐weighted: aOR, 1.51; 95% CI, 1.28–1.78), but the mean hospital length of stay was shorter (adjusted mean difference, original cohort: –2.01 [95% CI, –2.81 to –1.21] days; propensity score‐matched: –3.54 [95% CI, –6.39 to –0.69] days; inverse probability treatment‐weighted: –3.26 [95% CI, –6.01 to –0.50] days).
Conclusion: RPM was associated with greater 14‐day likelihood of hospital admission, but also with shorter mean length of stay and lower 28‐day mortality, which may indicate that clinical deterioration was detected and treated earlier than with usual care. The benefit of RPM for managing other acute health conditions in the community, particularly infectious diseases, should be examined.