


The known: Until 2023, the risk of a primary cardiovascular disease (CVD) event was assessed in Australia using clinical criteria and an outdated United States‐based equation that generally overestimated risk, but underestimated it in Aboriginal and Torres Strait Islander people.
The new: New Zealand equations for estimating CVD risk have been adapted and calibrated for use in Australia. The internal validity of both the general and diabetes‐specific equations is good, and they have been incorporated into the 2023 guideline‐recommended Australian CVD risk equation.
The implications: The new CVD risk calculator should substantially improve the accuracy of risk assessment, and consequently facilitate more targeted preventive pharmacotherapy and primary care.
The primary prevention of cardiovascular disease (CVD) is underpinned by the use of risk prediction equations to guide treatment decisions. To improve risk prediction accuracy, overseas CVD guidelines, including those for many European countries,1 the United States,2 New Zealand,3 and China,4 recommend equations developed using data from their own populations (eg, US PREVENT,5 New Zealand PREDICT,6,7 China‐PAR8) or regional equations calibrated for their populations (eg, European SCORE29).
Until recently, an algorithm that incorporated several clinical high risk criteria and the Framingham Risk Equation was recommended for estimating CVD risk in primary care in Australia.10 The Framingham Risk Equation, based on old data from a predominantly white American population, overestimates risk for the general Australian population11 and underestimates it for Aboriginal and Torres Strait Islander people.12
New Australian guidelines for assessing and managing CVD risk, including a new risk algorithm, were published in 2023.13,14 In the absence of large Australian contemporary population‐based datasets with information on CVD risk factors and linked event data, the new Australian risk algorithm was based on the New Zealand PREDICT equation,7 modified and recalibrated for the Australian population. The PREDICT equation was chosen because it was based on recent data, included established CVD risk factors and measures of socio‐economic deprivation, and predicted a broad range of CVD outcomes, because of the performance of the model and the ability to modify and recalibrate it.15
The new Australian CVD risk algorithm is recommended for people aged 45–79 years without a history of CVD, for people with diabetes aged 35 years or older, and for Aboriginal or Torres Strait Islander people aged 30 years or older.14,16 It includes three stages. First, people are assessed for clinical conditions that confer a high risk of CVD (moderate to severe chronic kidney disease or familial hypercholesterolaemia). Second, the risk equation is applied to people without the two clinically high risk conditions; this includes a general equation and a type 2 diabetes‐specific equation that incorporates additional variables. Third, clinicians can re‐categorise individual risk according to reclassification factors (ethnic background, chronic kidney disease, family history of premature CVD, coronary artery calcium score, severe mental illness).13
In this article, we describe the development of the CVD risk equations (stage two), outlining the modifications made to the New Zealand PREDICT risk equations for Australia, assessing the performance of the modified equations in the New Zealand PREDICT cohort, and describing the methods and reporting the data used for recalibrating the equations for Australia. The study was commissioned by the Heart Foundation of Australia as part of the process for updating the Australian guideline for assessing and managing CVD risk.
Methods
Study population used for deriving the PREDICT equations
The study population and development of the New Zealand PREDICT7,17 (NZ‐PREDICT) and diabetes‐specific PREDICT6 (NZ‐PREDICT‐Diabetes) risk equations have been described previously; they conform with Transparent Reporting of a multivariable prediction model for Individual Prognosis or Diagnosis (TRIPOD) recommendations (Supporting Information, part 1).18 The PREDICT dataset includes data for New Zealand residents aged 30–79 years who presented to primary care practices without diagnosed CVD, congestive heart failure, or renal disease and were formally assessed for CVD risk using PREDICT software during 1 October 2004 – 31 December 2016. Cardiovascular outcomes were determined by linkage with national hospitalisation and mortality datasets. During 1 October 2004 – 31 December 2016, formal CVD risk assessments were completed for about 90% of all eligible New Zealand residents aged 30–79 years.
Outcomes
The primary outcomes were those defined for deriving the New Zealand PREDICT equation: first hospitalisation or death from CVD, ascertained using International Classification of Diseases, tenth revision (ICD‐10) codes for ischaemic heart disease (including angina), ischaemic or haemorrhagic cerebrovascular events (including transient ischaemic attacks), and peripheral vascular disease, congestive heart failure, or other ischaemic cardiovascular disease (Supporting Information, table 1).
Modification of the PREDICT equations for Australia
The NZ‐PREDICT and NZ‐PREDICT‐Diabetes equations were modified by changing the inclusion criteria for the study population to more closely match the population composition of Australia and by removing some risk predictors.
The AUS‐PREDICT and AUS‐PREDICT‐Diabetes equations were based on a modified PREDICT cohort of people aged 30–79 years that excluded Māori, Pacific Islander, Middle Eastern, Latin American, and African people. Māori and Pacific Islander people were excluded because they comprise about 24.6% of the New Zealand population (2018 census)19 but less than 1% of the Australian population (2021 census).20 Middle Eastern, Latin American, and African people were excluded because their population proportions in New Zealand and Australia cannot be assumed to be the same; direct comparisons were difficult because of differences between the two countries in census questionnaires.
For application to Australia, the PREDICT equations6,7 were modified to exclude body mass index (BMI; from AUS‐PREDICT only), ethnic background, and family history of CVD. Overweight and obesity are important risk factors for CVD, but BMI was not included in the AUS‐PREDICT equation because it did not markedly influence calculated CVD risk; it was included in the AUS‐PREDICT‐Diabetes equation because it independently influenced predicted CVD risk in people with type 2 diabetes. Ethnic background was excluded because the New Zealand categories could not be readily applied to Australia. Family history of CVD was excluded because it did not markedly influence estimated CVD risk with the NZ‐PREDICT equation;7 however, both ethnic background and family history of CVD are included as reclassification factors in the third stage of the algorithm.16 Further details on the risk factors included in the AUS‐PREDICT and AUS‐PREDICT‐Diabetes equations are included in the Supporting Information, table 2.
Model performance of AUS‐PREDICT and AUS‐PREDICT‐Diabetes
The performance of the modified equations was assessed in the modified New Zealand PREDICT cohorts. Calibration of the AUS‐PREDICT and AUS‐PREDICT‐Diabetes equations (agreement of predicted and observed CVD risks) was assessed graphically by categorising participants into deciles of predicted 5‐year CVD risk, and plotting mean 5‐year predicted risk against observed 5‐year risk using the Kaplan–Meier method. Model discrimination (how well the model distinguishes between people who did or did not develop CVD) was assessed using the Harrell C‐statistic (measure of concordance; from 0.5 = no discrimination to 1.0 = perfect concordance)21 and the Royston D‐statistic (estimated separation between people with low or high predicted CVD risk; from zero to infinity, higher values indicating greater discrimination),22,23 each with 95% confidence intervals (CIs). We summarise cohort characteristics as means with standard deviations (SDs) or medians with interquartile ranges (IQRs). Statistical analyses were performed in Stata 13.0.
Recalibration
Recalibration is a statistical process for aligning predicted and observed risks; it typically involves replacing the mean risk factor values and baseline survival in the original equation with mean risk factor values and CVD‐free survival rate from the target population.24 At the time of development, suitable representative Australia datasets that included information on all risk factors included in the New Zealand PREDICT equations were not available for estimating predicted risks and mean risk factor levels, nor were national data on the incidence of the outcomes predicted by the risk equation (first fatal or non‐fatal event).
As the PREDICT equation is based on recent data and was well calibrated for the New Zealand population, we developed recalibration multipliers based on differences between Australia and New Zealand in age‐ and sex‐specific CVD mortality rates. As specific mortality rates for people with type 2 diabetes were not available, recalibration multipliers used for the AUS‐PREDICT equation were also applied to AUS‐PREDICT‐Diabetes. These recalibration multipliers are applied after risk estimation using the CVD risk equation; that is, they do not change the coefficients of the risk equation.
We calculated age‐ and sex‐specific five‐year (2014–2018 calendar years) mean CVD mortality rates for Australian the population aged 30–79 years, using annual age‐ and sex‐specific CVD mortality events and rates, based on ICD‐10 codes, reported by the Australian Bureau of Statistics in underlying cause of death statistics.25 Equivalent CVD mortality rates and numbers of deaths, based on ICD‐10 codes, for the New Zealand population aged 30–79 years (excluding Māori, Pacific Islander, Middle Eastern, Latin American, and African people, identified in linked National Health Index data) were derived from the linked New Zealand Ministry of Health Mortality Collection26 for the calendar years 2014–2018. Mortality rates for the youngest age groups were combined as a single category (30–44 years) because of the low numbers of CVD events. Mortality rate ratios were calculated as age‐ and sex‐specific mortality rates for CVD PREDICT outcomes in Australia divided by equivalent mortality rates in New Zealand.
As we could not recalibrate the equations using risk factor levels, we compared the prevalence of selected CVD risk factors (smoking, diabetes, blood pressure, cholesterol, medications for reducing blood pressure and cholesterol levels) in the Australian and New Zealand general populations by 10‐year age‐ and sex‐group (Supporting Information, part 2).
Ethics approval
The Northern Region Ethics Committee Y (New Zealand) approved the PREDICT study in 2003 (AKY/03/12/314), with annual approval from the National Multi Region Ethics Committee (New Zealand) since 2007 (MEC07/19/EXP). The Australian National University human research ethics committee approved the recalibration component of the study (2021_424).
Results
Performance of AUS‐PREDICT
After exclusions, the modified New Zealand cohort for deriving the AUS‐PREDICT risk equation included 308 478 people (134 137 women, 43.5%), 11 555 of whom (3.8%) had CVD events during follow‐up (median: women, 3.5 [IQR, 2.4–5.6] years; men, 3.3 [IQR, 2.3–5.5] years). The mean age at assessment was 58.5 (SD, 9.0) years for women and 53.8 (SD, 10.0) years for men; 106 634 women (79.5%) and 122 878 men (70.5%) had never smoked (Box 1, Box 2).
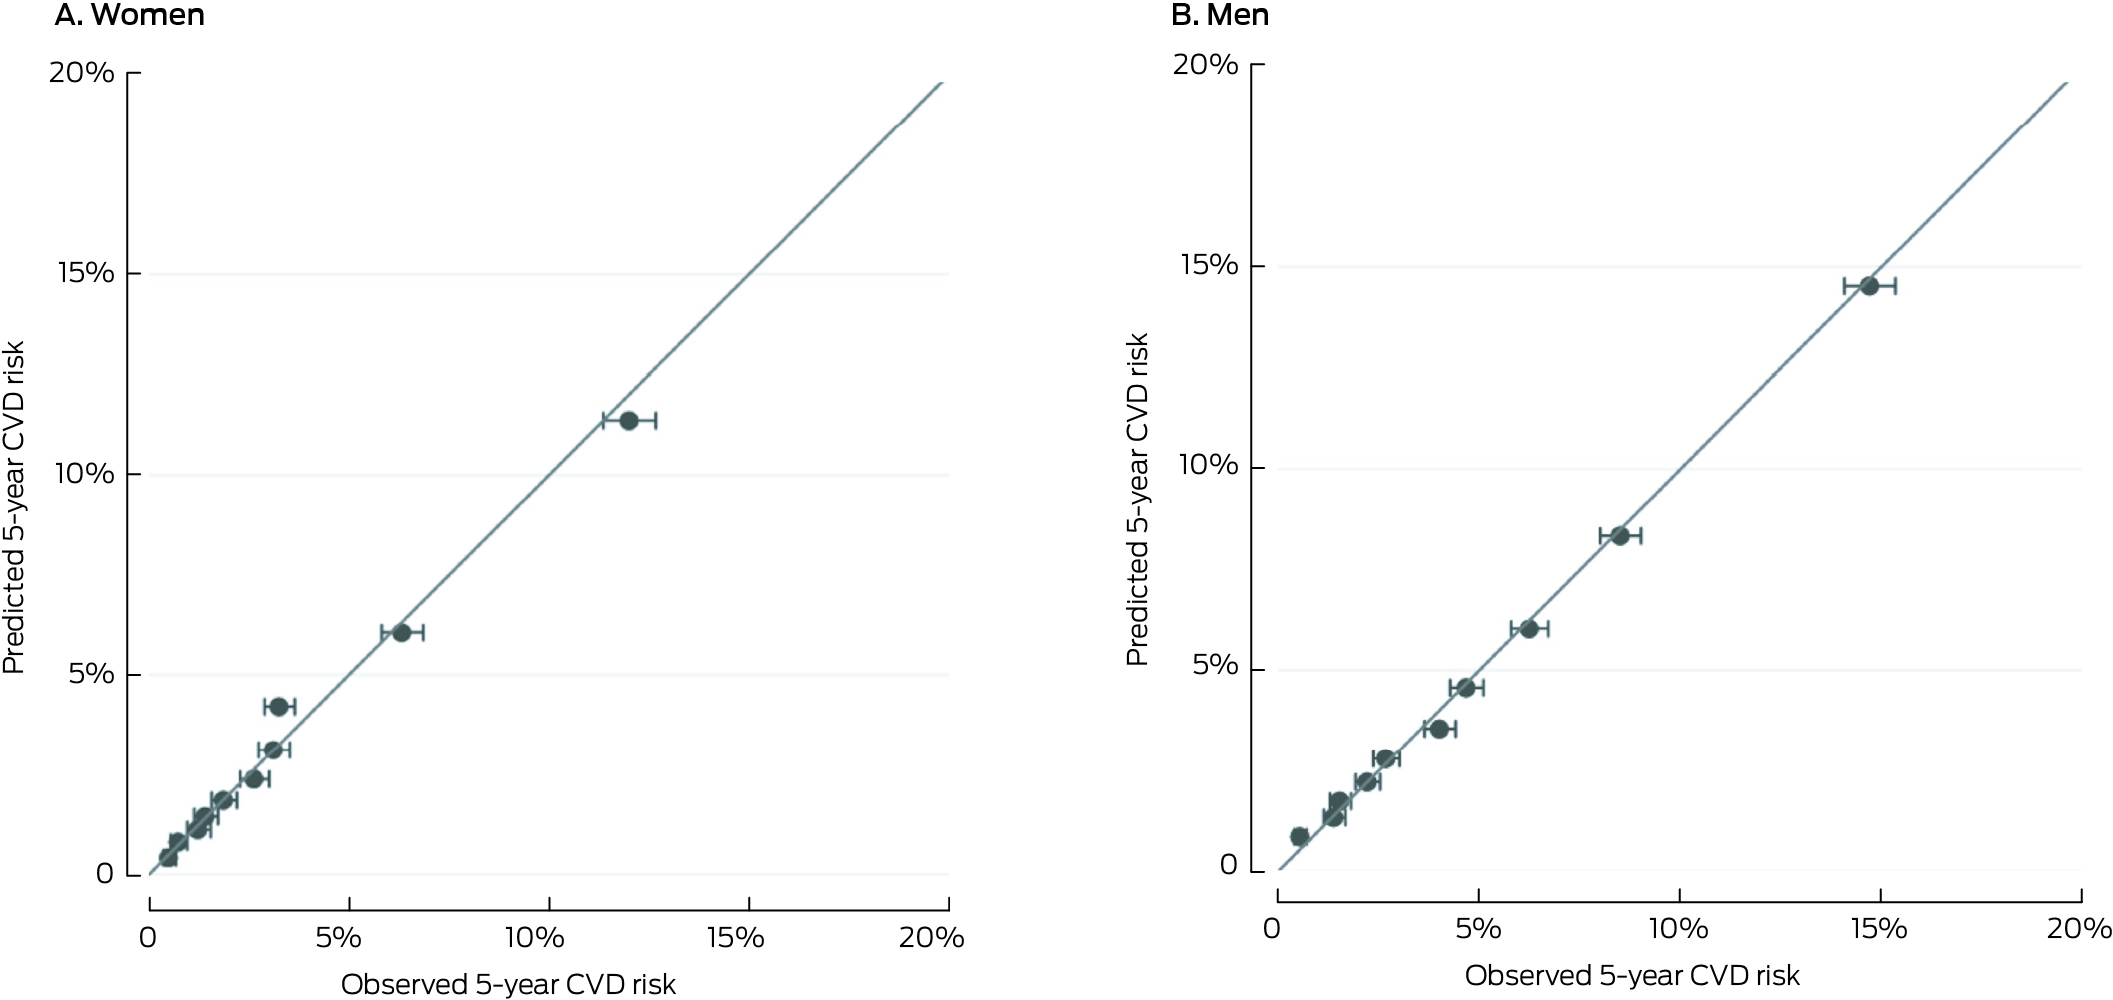
The predicted and observed CVD risks were closely aligned across risk deciles (Box 3) and age categories (Supporting Information, figure 1). The discrimination of the AUS‐PREDICT model was good for both women (C‐statistic, 0.75; 95% CI, 0.74–0.76; D‐statistic, 1.48; 95% CI, 1.43–1.53) and men (C‐statistic, 0.74; 95% CI, 0.73–0.74; D‐statistic, 1.35; 95% CI, 1.32–1.39) (Box 4).
Performance of AUS‐PREDICT‐Diabetes
After exclusions, 29 219 people with type 2 diabetes were included in the modified cohort for deriving the AUS‐PREDICT‐Diabetes risk equation, 2586 of whom (8.9%) had CVD events during follow‐up (median: women, 5.2 [IQR, 3.4–7.1] years; men, 5.1 [3.3–7.0] years). The mean time since diabetes diagnosis was 5.2 (SD, 5.5) years for women and 5.3 (SD, 5.6) years for men. The mean BMI was 30 kg/m2 (SD, 6.8 kg/m2) for women and 29 kg/m2 (SD, 5.5 kg/m2) for men (Box 5, Box 6).
The predicted and observed CVD risks were closely aligned across risk deciles (Box 7). The discrimination was acceptable for both women (C‐statistic, 0.73; 95% CI, 0.71–0.75; D‐statistic, 1.38; 95% CI, 1.28–1.49) and men (C‐statistic, 0.70; 95% CI, 0.68–0.71; D‐statistic, 1.17; 95% CI, 1.09–1.25) (Box 4).
Recalibration multipliers
Five‐year mean CVD mortality increased with age in both Australia and New Zealand; the mortality rate was higher in Australia than New Zealand for women and men aged 30–54 years, and lower for women and men aged 60–79 years (Box 8).
The prevalence of daily smoking, self‐reported type 2 diabetes, and use of blood pressure‐ or cholesterol‐lowering medications was similar in Australia and New Zealand for most age–sex groups, except that the use of blood pressure‐lowering medications was greater for men aged 75 years or older in New Zealand than in Australia, and the use of cholesterol‐lowering medications was greater for New Zealand men aged 65 years or older (Supporting Information, tables 3 to 5). Mean systolic blood pressure was lower for the New Zealand cohort than the Australian cohort (124.9 mmHg; 95% CI, 124.5–125.4 mmHg v 127.8 mmHg; 95% CI, 126.7–128.9 mmHg), but was not significantly different for men (Supporting Information, table 6); mean levels of total serum cholesterol were similar in the two countries (Supporting Information, table 7).
Discussion
The 2023 Australian CVD risk calculator is the first nationally recommended risk equation to be modified and recalibrated for the Australian population, improving our ability to accurately predict and prevent CVD events. It includes important risk factors, such as measures of socio‐economic deprivation, that independently predict CVD risk overseas but were not previously included in the Australian risk algorithm. Another key strength is that the risk equation was chosen following a comprehensive review of overseas guideline‐recommended CVD risk equations and comparison with a set of selection criteria pre‐defined at a National Stakeholder Roundtable on CVD risk attended by representatives from policy, clinical practice, and research bodies.15
The internal validity of both the AUS‐PREDICT and AUS‐PREDICT‐Diabetes equations were acceptable to good with respect to calibration and discrimination when assessed in the modified New Zealand PREDICT cohort. We outlined the processes and data used for recalibrating the risk equations to align predicted risks with those observed in Australia. Five‐year mean CVD‐specific mortality rates by age group and sex were similar in Australia and New Zealand, but they were slightly higher for Australians than New Zealanders aged 30–54 years, and slightly lower for Australians than New Zealanders aged 60–79 years.
The reported CVD mortality rate ratios were used to recalibrate the 2023 Australian CVD risk calculator by increasing or reducing the risk estimated by the equation. For example, if the estimated 5‐year CVD risk using AUS‐PREDICT for a 65‐year‐old man is 14%, the recalibrated risk is 11.2% (14% multiplied by the recalibration factor 0.8). This recalibration is applied automatically by the online risk calculator.16
Despite some differences between the Australian and New Zealand populations, including in underlying CVD risks, the new equations, based on recent data from a large (401 752 people) and diverse study group, are likely to predict risk more accurately for Australia than the previously recommended Framingham risk equation, based on data from a smaller cohort (8491 people, mostly white Americans) from 1948.28 The New Zealand PREDICT equations outperform the United States Pooled Cohort Equations (which replaced the Framingham risk equation in the United States, but were themselves replaced by PREVENT in 2023), which overestimate major CVD risk in New Zealand by 40% in men and 60% in women.7
All people with type 2 diabetes with certain features (eg, over 60 years of age, microalbuminuria) were previously classified as being at high risk of CVD.10 However, not all people with type 2 diabetes have the same CVD risk, and including more clinical risk variables, such as BMI, estimated glomerular filtration rate, and urinary albumin:creatinine ratio, in the new Australian CVD risk calculator allows more nuanced and accurate risk assessment.7
Limitations
Despite the substantial advantages of the new Australian CVD risk calculator compared with earlier calculators, several limitations should be considered. First, the performance measures described in this study were obtained by applying the modified risk equation in the New Zealand PREDICT cohort used for model derivation. It is unclear how well the modified equations perform in Australia, and validation of AUS‐PREDICT and AUS‐PREDICT‐Diabetes equations in an Australian primary care dataset is needed.
Second, recalibration was based on differences between Australia and New Zealand in CVD mortality rates and could not be undertaken using CVD incidence data. The high quality national‐level data on cause‐specific mortality available in both countries are probably more appropriate for comparisons than hospital data, which are influenced by differences in factors such as coding, hospital bed availability, and admission practices. However, our key assumption is that the mortality rate ratio and the ratio of CVD incidence in Australia and New Zealand are similar. This assumption might not hold if there are differences between the countries in risk assessment and access to preventive treatment, or in post‐event survival.
Third, recalibration did not consider differences between Australia and New Zealand in risk factor levels, instead assuming that they are similar in both countries and that baseline hazard is more important for determining CVD risk. This assumption is supported by a study in India which found that recalibration was more sensitive to estimated survival baseline rates than to individual risk factor levels.29 Our finding that the prevalence of several key CVD risk factors was similar in Australia and New Zealand further supports this assumption.
Fourth, data quality and availability precluded recalibration by ethnic background, for Aboriginal and Torres Strait Islander people, or for people with type 2 diabetes. As CVD event rates are probably higher in these groups than in the general population, the new CVD risk equation may underestimate risk for people in these groups. The new risk calculator allows a general practitioner to reclassify the risk category for an individual according to these factors.
Fifth, the new CVD risk calculator is based on equations derived from an overseas population. To improve its accuracy for the diverse Australian population, CVD risk equations derived from one or more large, representative, contemporary Australian datasets are needed. This is particularly important for predicting CVD risk in Aboriginal and Torres Strait Islander people, which should be Indigenous‐led and based on First Nations data with appropriate data sovereignty. Problems with access to cross‐jurisdictional data makes developing a CVD risk calculator based on Australian population data difficult.
Finally, intellectual property restrictions prevented us publishing the coefficients for the new Australian calculator during their incorporation into primary care software. They are, however, available to researchers on request (see data sharing statement).
Conclusions
The 2023 Australian CVD risk calculator, based on the New Zealand PREDICT CVD equations is a landmark advance in the assessment of CVD risk in Australian primary care. The New Zealand equations have been modified and recalibrated for use in Australia. Further work is needed to develop CVD risk prediction tools based on Australian population‐specific data that can be readily recalibrated over time, but the new calculator overcomes many of the limitations of the previous risk assessment algorithm.
Box 1 – Australian cardiovascular disease (CVD) risk prediction equation (AUS‐PREDICT): cohort selection from the New Zealand PREDICT cohort and incidence of CVD events during follow‐up
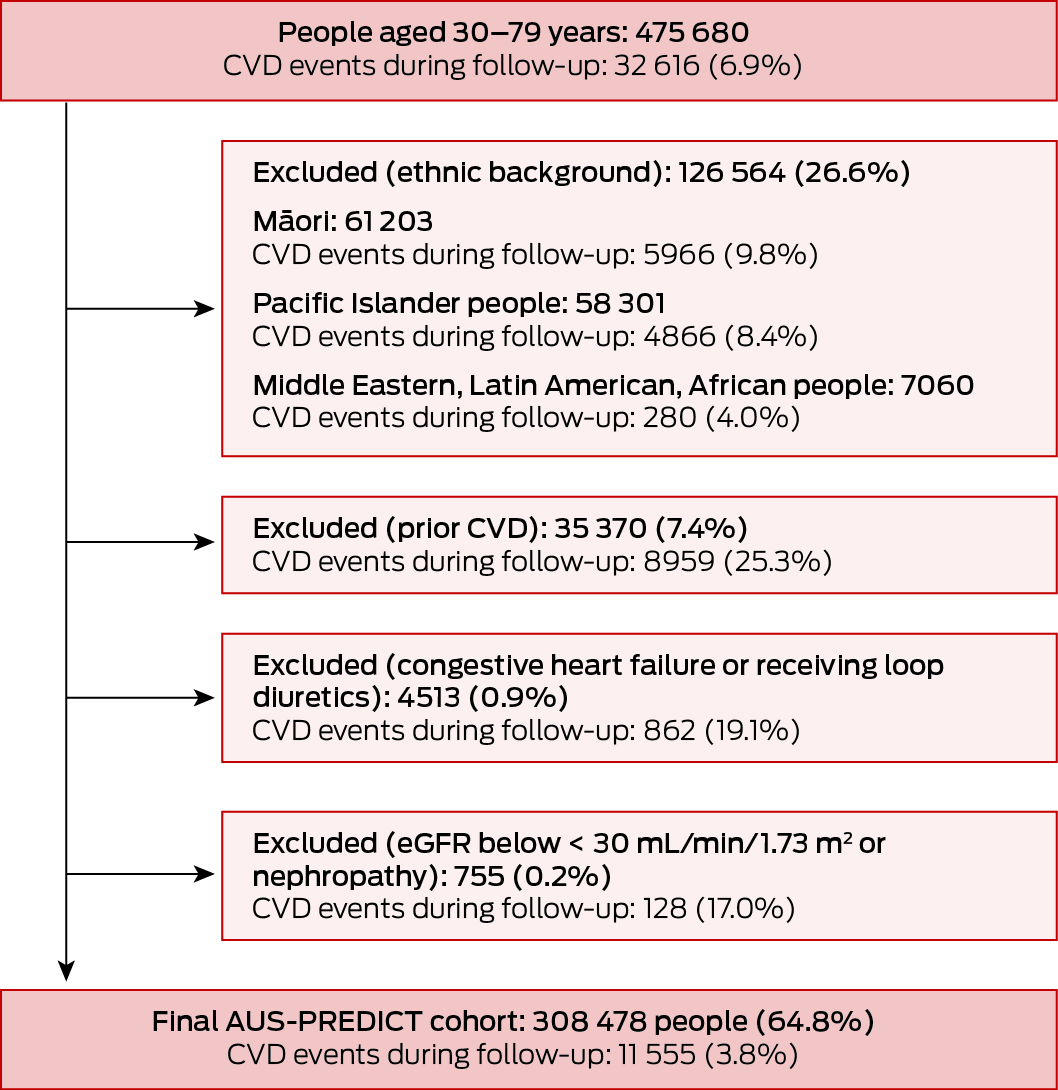
eGFR = estimated glomerular filtration rate.
Box 2 – Characteristics of the New Zealand PREDICT cohort used to derive the Australian general cardiovascular disease risk prediction equation, by sex
|
Characteristic |
Women |
Men |
|||||||||||||
|
|
|||||||||||||||
|
Number of people |
134 137 [43.5%] |
174 341 [56.5%] |
|||||||||||||
|
Incident cardiovascular disease |
4247 (3.2%) |
7308 (4.2%) |
|||||||||||||
|
Follow‐up (years), median (IQR) |
3.5 (2.4–5.6) |
3.3 (2.3–5.5) |
|||||||||||||
|
Age (years), mean (SD) |
58.5 (9.0) |
53.8 (10.0) |
|||||||||||||
|
Socio‐economic deprivation quintile27 |
|
|
|||||||||||||
|
1 (least deprived) |
36 840 (27.5%) |
48 081 (27.6%) |
|||||||||||||
|
2 |
31 281 (23.3%) |
40 718 (23.4%) |
|||||||||||||
|
3 |
27 070 (20.2%) |
34 575 (19.8%) |
|||||||||||||
|
4 |
23 162 (17.3%) |
29 879 (17.1%) |
|||||||||||||
|
5 (most deprived) |
15 784 (11.8%) |
21 088 (12.1%) |
|||||||||||||
|
Smoking status |
|
|
|||||||||||||
|
Never smoked |
106 634 (79.5%) |
122 878 (70.5%) |
|||||||||||||
|
Formerly smoked |
17 633 (13.2%) |
31 070 (17.8%) |
|||||||||||||
|
Currently smokes |
9870 (7.4%) |
20 391 (11.7%) |
|||||||||||||
|
Systolic blood pressure (mmHg), mean (SD) |
129 (17.5) |
129 (16.1) |
|||||||||||||
|
Ratio total cholesterol to high density lipoprotein cholesterol (mean, SD) |
3.6 (1.1) |
4.3 (1.2) |
|||||||||||||
|
Medical history |
|
|
|||||||||||||
|
Diabetes |
16 154 (12.0%) |
20 234 (11.6%) |
|||||||||||||
|
Atrial fibrillation |
1548 (1.2%) |
3250 (1.9%) |
|||||||||||||
|
Medications |
|
|
|||||||||||||
|
Blood pressure‐lowering |
35 940 (26.8%) |
34 903 (20.0%) |
|||||||||||||
|
Lipid‐lowering |
21 954 (16.4%) |
27 350 (15.7%) |
|||||||||||||
|
Antiplatelets/anticoagulants |
13 547 (10.1%) |
17 669 (10.1%) |
|||||||||||||
|
|
|||||||||||||||
|
IQR = interquartile range; SD = standard deviation. |
|||||||||||||||
Box 3 – The general Australian cardiovascular disease (CVD) risk prediction equation (AUS‐PREDICT) in the New Zealand PREDICT cohort, all ages: calibration plots, by sex
Box 4 – The Australian general and diabetes‐specific cardiovascular disease risk prediction equations performance statistics*
|
Statistic |
AUS‐PREDICT |
AUS‐PREDICT‐Diabetes |
|||||||||||||
|
|
|||||||||||||||
|
Women |
|
|
|||||||||||||
|
Harrell C (95% CI) |
0.75 (0.74–0.76) |
0.73 (0.71–0.75) |
|||||||||||||
|
Royston D (95% CI) |
1.48 (1.43–1.53) |
1.38 (1.28–1.49) |
|||||||||||||
|
Men |
|
|
|||||||||||||
|
Harrell C (95% CI) |
0.74 (0.73–0.74) |
0.70 (0.68–0.71) |
|||||||||||||
|
Royston D (95% CI) |
1.35 (1.32–1.39) |
1.17 (1.09–1.25) |
|||||||||||||
|
|
|||||||||||||||
|
CI = confidence interval. * Harrell C‐statistic is a measure of concordance (from 0.5 = no discrimination to 1.0 = perfect concordance);21 the Royston D‐statistic is an estimate of separation between people with low or high predicted CVD risk, from zero to infinity, higher values indicating greater discrimination.22,23 |
|||||||||||||||
Box 5 – Australian cardiovascular disease (CVD) diabetes‐specific risk prediction equation (AUS‐PREDICT‐Diabetes): cohort selection from the New Zealand PREDICT cohort and incidence of CVD events during follow‐up

eGFR = estimated glomerular filtration rate.
Box 6 – Characteristics of the New Zealand PREDICT cohort used to derive the Australian diabetes‐specific cardiovascular disease risk prediction equation, by sex
|
Characteristic |
Women |
Men |
|||||||||||||
|
|
|||||||||||||||
|
Number of people |
13 246 [45.3%] |
15 973 [54.7%] |
|||||||||||||
|
Time since diabetes diagnosis (years), mean (SD) |
5.2 (5.5) |
5.3 (5.6) |
|||||||||||||
|
Incident cardiovascular disease |
961 (7.3%) |
1625 (10.2%) |
|||||||||||||
|
Follow‐up (years), median (IQR) |
5.2 (3.4–7.1) |
5.1 (3.3–7.0) |
|||||||||||||
|
Age (years), mean (SD) |
57.8 (11.1) |
56.6 (11.3) |
|||||||||||||
|
Socio‐economic deprivation quintile27 |
|
|
|||||||||||||
|
1 (least deprived) |
2362 (17.8%) |
3361 (21.0%) |
|||||||||||||
|
2 |
2669 (20.2%) |
3299 (20.7%) |
|||||||||||||
|
3 |
2800 (21.1%) |
3352 (21.0%) |
|||||||||||||
|
4 |
2997 (22.6%) |
3400 (21.3%) |
|||||||||||||
|
5 (most deprived) |
2418 (18.3%) |
2561 (16.0%) |
|||||||||||||
|
Smoking status |
|
|
|||||||||||||
|
Does not smoke |
12 327 (93.1%) |
13 847 (86.7%) |
|||||||||||||
|
Smokes |
919 (6.9%) |
2126 (13.3%) |
|||||||||||||
|
Systolic blood pressure (mmHg), mean (SD) |
132 (15.6) |
132 (14.8) |
|||||||||||||
|
Ratio total cholesterol to high density lipoprotein cholesterol (mean, SD) |
3.9 (1.2) |
4.3 (1.3) |
|||||||||||||
|
Body mass index (kg/m2), mean (SD) |
30 (6.8) |
29 (5.5) |
|||||||||||||
|
eGFR (mL/min/1.73 m2), mean (SD) |
88.4 (17.6) |
88.2 (16.7) |
|||||||||||||
|
HbA1c (mmol/mol), mean (SD) |
56.1 (16.1) |
57.8 (17.5) |
|||||||||||||
|
Albumin to creatinine ratio |
|
|
|||||||||||||
|
< 3 mg/mmol |
10 035 (75.8%) |
11 989 (75.1%) |
|||||||||||||
|
3–30 mg/mmol |
2846 (21.5%) |
3384 (21.2%) |
|||||||||||||
|
> 30 mg/mmol |
365 (2.8%) |
600 (3.8%) |
|||||||||||||
|
Atrial fibrillation |
190 (1.4%) |
361 (2.3%) |
|||||||||||||
|
Medications |
|
|
|||||||||||||
|
Blood pressure‐lowering |
8099 (61.1%) |
9120 (57.1%) |
|||||||||||||
|
Lipid‐lowering |
7170 (54.1%) |
9053 (56.7%) |
|||||||||||||
|
Antiplatelets/anticoagulants |
4551 (34.4%) |
6318 (39.6%) |
|||||||||||||
|
Insulin |
782 (5.9%) |
922 (5.8%) |
|||||||||||||
|
Oral diabetes medications |
8503 (64.2%) |
10 356 (64.8%) |
|||||||||||||
|
|
|||||||||||||||
|
eGFR = estimated glomerular filtration rate; HbA1c = glycated haemoglobin A1c; IQR = interquartile range; SD = standard deviation. |
|||||||||||||||
Box 7 – The diabetes‐specific Australian cardiovascular disease (CVD) risk prediction equation (AUS‐PREDICT‐Diabetes) in the New Zealand PREDICT cohort, all ages: calibration plots, by sex

Box 8 – Five‐year mean cardiovascular disease‐specific mortality (per 100 000 people, with standard deviations), Australia and New Zealand, 2014–2018 (calendar years), and rate ratios, by age group and sex*
|
|
Women |
Men |
|||||||||||||
|
Age group (years) |
Australia |
New Zealand |
Rate ratio |
Australia |
New Zealand |
Rate ratio |
|||||||||
|
|
|||||||||||||||
|
30–44 |
4.0 (0.5) |
3.0 (1.6) |
1.3 |
10.7 (0.6) |
9.6 (1.1) |
1.1 |
|||||||||
|
45–49 |
12.0 (1.5) |
9.9 (1.8) |
1.2 |
37.3 (3.7) |
35.5 (7.1) |
1.1 |
|||||||||
|
50–54 |
18.3 (1.4) |
15.9 (5.9) |
1.2 |
59.8 (3.4) |
56.7 (11.6) |
1.1 |
|||||||||
|
55–59 |
28.6 (1.5) |
28.0 (2.9) |
1.0 |
90.5 (1.9) |
94.5 (8.4) |
1.0 |
|||||||||
|
60–64 |
43.4 (4.1) |
47.3 (3.3) |
0.9 |
136.6 (9.7) |
159.3 (8.8) |
0.9 |
|||||||||
|
65–69 |
79.3 (6.6) |
102.5 (14.4) |
0.8 |
210.9 (9.5) |
257.9 (29.6) |
0.8 |
|||||||||
|
70–74 |
161.8 (10.8) |
219.3 (20.0) |
0.7 |
359.9 (19.4) |
443.6 (42.6) |
0.8 |
|||||||||
|
75–79 |
378.1 (32.7) |
510.7 (74.4) |
0.7 |
664.4 (50.2) |
883.8 (68.3) |
0.8 |
|||||||||
|
|
|||||||||||||||
|
* Australian rates calculated from cause of death data provided (at the request of the authors) by the Australian Bureau of Statistics; New Zealand rates were derived from New Zealand Ministry of Health Mortality Collection data.26 Cardiovascular disease was ascertained using International Classification of Diseases tenth revision (ICD‐10) codes (Supporting Information, table 1). |
|||||||||||||||
Received 24 May 2024, accepted 4 February 2025
- Ellie Paige1,2,3
- Emily Banks AM2
- Yuehan Zhang2
- Anushka Patel4,5
- Mark Woodward4,6
- Natalie Raffoul7
- Garry Jennings8
- Rodney T Jackson9
- 1 QIMR Berghofer Medical Research Institute, Brisbane, QLD
- 2 National Centre for Epidemiology and Population Health, Australian National University, Canberra, ACT
- 3 The University of Queensland, Brisbane, QLD
- 4 The George Institute for Global Health, Sydney, NSW
- 5 Sydney Medical School, the University of Sydney, Sydney, NSW
- 6 The George Institute for Global Health, Imperial College London, London, United Kingdom
- 7 National Heart Foundation of Australia, Sydney, NSW
- 8 National Heart Foundation of Australia, Melbourne, VIC
- 9 The University of Auckland, Auckland, New Zealand
Correspondence: ellie.paige@anu.edu.au
Open access:
Open access publishing facilitated by Australian National University, as part of the Wiley – Australian National University agreement via the Council of Australian University Librarians.
Data Sharing:
The de‐identified data analysed for development of the PREDICT cohort are not publicly available, but requests to the corresponding author will be considered on a case‐by‐case basis. A licence to use the hazard ratios and beta‐coefficients for AUS‐PREDICT and AUS‐PREDICT‐Diabetes can be requested for research purposes. Any research group can request the technical specifications and the equations by contacting the Heart Foundation (
The project was commissioned by the National Heart Foundation of Australia on behalf of the Australian Chronic Disease Prevention Alliance as part of a national project to update the Australian cardiovascular disease risk guideline and risk calculator. The project was supported by the Australian Department of Health and Aged Care. Emily Banks (APP2017742) and Anushka Patel (APP2016801) are supported by National Health and Medical Research Council (NHMRC) Investigator grants. Mark Woodward is supported by NHMRC grants (APP1149987, APP1174120). Ellie Paige was supported by a Postdoctoral Fellowship (102131) from the National Heart Foundation of Australia (2018–2022) and is currently supported by a Future Leader Fellowship (107210) from the National Heart Foundation of Australia (2024–2027).
Emily Banks, Rod Jackson, Ellie Paige, Mark Woodward, and Anushka Patel were members of the Algorithm Expert Subgroup that interpreted the evidence and made recommendations to the Guideline Expert Steering Group on aspects related to the risk equation and overall algorithm as part of the updating of the Australian guidelines on cardiovascular disease risk assessment and management. Emily Banks chaired the Algorithm Expert Subgroup and was a member of the Guideline Expert Steering Group. Garry Jennings co‐chaired the Guideline Expert Steering Group updating the Australian guidelines on CVD risk assessment and management; he is Chief Medical Adviser to the National Heart Foundation of Australia. Natalie Raffoul chaired the Guideline Advisory Group, and her team at the National Heart Foundation of Australia led the guideline project. Mark Woodward has worked as a paid consultant to Amgen and Freeline in the past three years. Anushka Patel is a non‐remunerated director and chair of George Medicines, which has received investment and grants to develop fixed‐dose combination therapies for cardiovascular disease prevention.
- 1. Piepoli MF, Hoes AW, Agewall S, et al; ESC Scientific Document Group. 2016 European guidelines on cardiovascular disease prevention in clinical practice: the Sixth Joint Task Force of the European Society of Cardiology and Other Societies on Cardiovascular Disease Prevention in Clinical Practice developed with the special contribution of the European Association for Cardiovascular Prevention & Rehabilitation. Eur Heart J 2016; 37: 2315‐2381.
- 2. Arnett DK, Blumenthal RS, Albert MA, et al. 2019 ACC/AHA guideline on the primary prevention of cardiovascular disease: a report of the American College of Cardiology/American Heart Association Task Force on Clinical Practice Guidelines. Circulation 2019; 140: e596‐e646.
- 3. New Zealand Ministry of Health. Cardiovascular disease risk assessment and management for primary care. 2018. https://www.tewhatuora.govt.nz/assets/Publications/Cardiovascular‐Publications/cardiovascular‐disease‐risk‐assessment‐management‐primary‐care‐feb18‐v4_0.pdf (viewed Jan 2025).
- 4. Chinese Society of Cardiology of Chinese Medical Association; Cardiovascular Disease Committee of Chinese Association of Gerontology Geriatrics; Thrombosis Prevention Treatment Committee of Chinese Medical Doctor Association. Chinese guideline on the primary prevention of cardiovascular diseases. Cardiol Discov 2021; 1: 70‐104.
- 5. Khan SS, Coresh J, Pencina MJ, et al; American Heart Association. Novel prediction equations for absolute risk assessment of total cardiovascular disease incorporating cardiovascular‐kidney‐metabolic health: a scientific statement from the American Heart Association. Circulation 2023; 148: 1982‐2004.
- 6. Pylypchuk R, Wells S, Kerr A, et al. Cardiovascular risk prediction in type 2 diabetes before and after widespread screening: a derivation and validation study. Lancet 2021; 397: 2264‐2274.
- 7. Pylypchuk R, Wells S, Kerr A, et al. Cardiovascular disease risk prediction equations in 400 000 primary care patients in New Zealand: a derivation and validation study. Lancet 2018; 391: 1897‐1907.
- 8. Yang X, Li J, Hu D, et al. Predicting the 10‐year risks of atherosclerotic cardiovascular disease in Chinese population: the China‐PAR project (prediction for ASCVD risk in China). Circulation 2016; 134: 1430‐1440.
- 9. SCORE2 working group; ESC Cardiovascular risk collaboration. SCORE2 risk prediction algorithms: New models to estimate 10‐year risk of cardiovascular disease in Europe. Eur Heart J 2021; 42: 2439‐2454.
- 10. National Vascular Disease Prevention Alliance. Guidelines for the management of absolute cardiovascular disease risk. 2012. Archived: https://webarchive.nla.gov.au/awa/20150321043446/http://strokefoundation.com.au/health‐professionals/clinical‐guidelines/guidelines‐for‐the‐assessment‐and‐management‐of‐absolute‐cvd‐risk (viewed Jan 2025).
- 11. Zomer E, Owen A, Magliano DJ, et al. Validation of two Framingham cardiovascular risk prediction algorithms in an Australian population: the “old” versus the “new” Framingham equation. Eur J Cardiovasc Prev Rehabil 2011; 18: 115‐120.
- 12. Wang Z, Hoy WE. Is the Framingham coronary heart disease absolute risk function applicable to Aboriginal people? Med J Aust 2005; 182: 66‐69. https://www.mja.com.au/journal/2005/182/2/framingham‐coronary‐heart‐disease‐absolute‐risk‐function‐applicable‐aboriginal
- 13. Australian Chronic Disease Prevention Alliance. Australian guideline for assessing and managing cardiovascular disease risk. 2023. https://d35rj4ptypp2hd.cloudfront.net/pdf/Guideline‐for‐assessing‐and‐managing‐CVD‐risk_20230522.pdf (viewed Jan 2025).
- 14. Nelson M. Banks E, Brown A, et al. Australian guideline for assessing and managing cardiovascular disease risk. Med J Aust 2023; 220: 482‐490. https://www.mja.com.au/journal/2024/220/9/2023‐australian‐guideline‐assessing‐and‐managing‐cardiovascular‐disease‐risk
- 15. Brown S, Banks E, Woodward M, et al. Evidence supporting the choice of a new cardiovascular risk equation for Australia. Med J Aust 2023; 219: 173‐186. https://www.mja.com.au/journal/2023/219/4/evidence‐supporting‐choice‐new‐cardiovascular‐risk‐equation‐australia
- 16. Australian Chronic Disease Prevention Alliance. Australian CVD risk calculator. 2023. https://www.cvdcheck.org.au/calculator (viewed Dec 2024).
- 17. Wells S, Riddell T, Kerr A, et al. Cohort profile: the PREDICT cardiovascular disease cohort in New Zealand primary care (PREDICT‐CVD 19). Int J Epidemiol 2017; 46: 22.
- 18. Collins GS, Reitsma JB, Altman DG, Moons KG; TRIPOD Group. Transparent reporting of a multivariable prediction model for individual prognosis or diagnosis (TRIPOD): the TRIPOD statement. Circulation 2015; 131: 211‐219.
- 19. Stats NZ. New Zealand's population reflects growing diversity. 23 Sept 2019. https://www.stats.govt.nz/news/new‐zealands‐population‐reflects‐growing‐diversity (viewed Dec 2024).
- 20. Australian Bureau of Statistics. Estimates of Aboriginal and Torres Strait Islander Australians, 30 June 2021. 31 Aug 2023. https://www.abs.gov.au/statistics/people/aboriginal‐and‐torres‐strait‐islander‐peoples/estimates‐aboriginal‐and‐torres‐strait‐islander‐australians/latest‐release (viewed Dec 2024).
- 21. Harrell FE, Califf RM, Pryor DB, et al. Evaluating the yield of medical tests. JAMA 1982; 247: 2543‐2546.
- 22. Royston P. Explained variation for survival models. Stata J 2006; 6: 83‐96.
- 23. Royston P, Sauerbrei W. A new measure of prognostic separation in survival data. Stat Med 2004; 23: 723‐748.
- 24. Woodward M. Risk scores and clinical decision rules. In: Epidemiology: study design and data analysis. Third edition. Hoboken: CRC Press, 2013; pp. 605‐678.
- 25. Australian Bureau of Statistics. Causes of death, Australia. https://www.abs.gov.au/statistics/health/causes‐death/causes‐death‐australia (viewed Jan 2025).
- 26. New Zealand Ministry of Health. Mortality data and statistics 2021. https://www.health.govt.nz/statistics‐research/statistics‐and‐data‐sets/mortality (viewed Jan 2025).
- 27. University of Otago. Socioeconomic deprivation indexes: NZDep and NZiDep. 2025. http://www.otago.ac.nz/wellington/departments/publichealth/research/hirp/otago020194.html (viewed June 2025).
- 28. D’Agostino RB, Vasan RS, Pencina MJ, et al. General cardiovascular risk profile for use in primary care: the Framingham heart study. Circulation 2008; 117: 743‐753.
- 29. Chow CK, Joshi R, Celermajer DS, Neal BC. Recalibration of a Framingham risk equation for a rural population in India. J Epidemiol Community Health 2009; 63: 379‐385.
Abstract
Objectives: To modify, recalibrate, and test the performance of the New Zealand cardiovascular disease (CVD) risk equations (PREDICT) for application in Australia.
Study design: Model updating study.
Setting, participants: New Zealand residents aged 30–79 years who presented to primary care practices without diagnosed CVD, congestive heart failure, or renal disease and whose CVD risk was assessed using PREDICT software during 1 October 2004 – 31 December 2016. For adapting the PREDICT equations to Australia, Māori, Pacific Islander, Middle Eastern, Latin American, and African people were excluded because of demographic differences between the two countries.
Intervention: The New Zealand PREDICT equations (general and diabetes‐specific versions) were recalibrated for Australia, based on differences between Australia and New Zealand in CVD‐specific mortality by age group and sex. Body mass index (BMI), ethnic background, and family history of CVD were omitted as variables in the general equation; BMI was retained in the diabetes‐specific equation.
Main outcome measures: Risk prediction outcomes: first CVD‐specific hospitalisation or death. Model performance measures: calibration of the modified equations, assessed by plotting mean 5‐year predicted risk against observed 5‐year risk; model discrimination, assessed with the HarrellC statistic.
Results: The modified New Zealand cohort for deriving the general AUS‐PREDICT risk equation included 308 478 people (134 137 women, 43.5%); the modified cohort for deriving the diabetes‐specific risk equation included 29 219 people with type 2 diabetes (13 246 women, 45.3%). For the general equation, predicted and observed CVD risks were closely aligned across risk deciles; discrimination was good for both women (C ‐statistic, 0.75; 95% confidence interval [CI], 0.74–0.76) and men (C ‐statistic, 0.74; 95% CI, 0.73–0.74). For the diabetes‐specific equation, predicted and observed CVD risks were also closely aligned across risk deciles; discrimination was acceptable for both women (C ‐statistic, 0.73; 95% CI, 0.71–0.75) and men (C ‐statistic, 0.70; 95% CI, 0.68–0.71).
Conclusions: The internal validity of the new Australian CVD risk algorithm, recommended in the 2023 Australian CVD risk assessment and management guidelines, is good and has been recalibrated for use in Australia. The updated risk calculator is a landmark advance in the assessment of CVD risk in Australian primary care.