


The known: Non‐technical errors contribute to the deaths of patients receiving surgical care in Australia.
The new: The frequency of fatal non‐technical errors differs between surgical specialties. However, it is high for the five specialties with the largest numbers of surgical care‐related deaths (general, cardiothoracic, orthopaedic, vascular, and neurosurgery) and did not change markedly during 2012–2019.
The implications: General improvements in non‐technical skills are required to avert avoidable deaths among people receiving surgical care in Australia. Specialty‐specific interventions could target certain identified problems, but systemwide strategies should receive priority.
Non‐technical skills, the cognitive and interpersonal components of medical professionalism, encompass a diverse range of behaviours in four domains: decision making, situational awareness, communication and teamwork, and leadership.1,2
Non‐technical skill failures (non‐technical errors) in surgical care contribute to preventable adverse events and patient harm.3 Communication breakdowns were implicated as causative factors in 24% of 444 surgery malpractice claims submitted to four United States liability insurers during 2006,4 and 43% of preventable adverse events in three American teaching hospitals during 2000–01.5 Errors in judgement, surgery‐related decision making, and inadequate patient assessment contribute to patient harm.6,7,8 In a recent large study, we found that 64% of surgical fatalities in Australia during 2012–2019 that had been flagged with adverse event or areas of concern were associated with non‐technical errors, most frequently decision making and situational awareness errors; their likelihood was influenced by hospital and admission type, and by patient demographic characteristics.9
These studies indicate that non‐technical skills are important for surgical safety, and also identified broad priority areas in which improvement is needed. However, whether the risk of non‐technical errors differs by surgical specialty is unknown. Surgical specialties in Australia differ with respect to patient demographic characteristics, managed diagnoses, accepted surgical risk, and expected outcomes. It is possible that the incidence and characteristics of non‐technical errors also differ between specialties, and that generic, systemwide non‐technical skills improvement strategies could therefore be ineffective.
We investigated the frequency of non‐technical errors in cases of surgical care‐related deaths in Australia by surgical specialty, with the aim of providing information that could guide non‐technical skills improvement strategies.
Methods
We undertook a retrospective cohort study, analysing Australian and New Zealand Audit of Surgical Mortality (ANZASM) data for Australia prospectively collected during 2012–2019. We report our study in accordance with the Strengthening the Reporting of Observational Studies in Epidemiology (STROBE) guidelines.10
ANZASM is a national, peer‐reviewed mortality audit overseen by the Royal Australasian College of Surgeons (RACS).11 Every in‐hospital death associated with surgical care must be reported to ANZASM; all cases in which a surgeon was appreciably involved in the care of the patient, whether the patient underwent an operation or not, are included.12 For each case, the responsible surgeon completes a standardised report on the care they provided. The report is de‐identified and sent to an independent consultant surgeon in the same specialty for initial assessment, with the purpose of identifying aspects of care that could be improved or could have contributed to the patient's death, categorised using a hierarchical system as areas for consideration, areas of concern, or adverse events. If a conclusion cannot be reached, the case is sent to another independent consultant surgeon for second line review.
Study aims
The study had four specific aims:
- to investigate the proportions of surgical care‐related deaths associated with non‐technical errors by specialty, overall and by domain;
- to compare the probability of fatal non‐technical errors by specialty;
- to investigate change in the non‐technical error proportion over time by specialty (as a surrogate marker of improvement); and
- to investigate the influence of patient and admission factors on the proportions of surgical care‐related deaths associated with fatal non‐technical errors by specialty.
Data source and assessment for non‐technical errors
We included all surgical care‐related deaths in Australia (except New South Wales) during 1 January 2012 – 31 December 2019 that had been flagged in ANZASM as being associated with an adverse event or area for concern. New South Wales mortality data are reported to the Collaborating Hospitals Audit of Surgical Mortality (CHASM), not ANZASM, and were therefore not included in our analysis. We applied no exclusion criteria with respect to surgical specialty, clinical context, or patient demographic characteristics.
For our study, we assessed each flagged case using the System for Identification and Categorization of Non‐technical Error in Surgical Settings (SICNESS),1 a reliable and validated tool developed by the authors, for identifying non‐technical errors linked with patient deaths and to categorise such errors by domain: communication and teamwork, decision making, situational awareness, and leadership. The SICNESS was independently applied to each case by two reviewers (author JE and one of OL, KH, MH, or VK) to determine whether a non‐technical error was linked with the death (fatal non‐technical error) and the non‐technical skills domain for each error. Reviewer disagreements were adjudicated by a third reviewer, a senior consultant surgeon (JBN) with extensive experience in non‐technical skills research and education. Cases were categorised by surgical specialty according to the specialty of the surgeon responsible for patient care. Additional information collected included hospital type (public or private), admission status (emergency or elective), patient status (public, private, or veteran), and patient age and biological sex (male or female, as recorded on surgeon case forms, based on medical documentation at the time of care).
Statistical analyses
The frequency of fatal non‐technical errors (overall and by domain) is reported as a proportion of all flagged deaths by specialty. The statistical significance of unadjusted differences in proportions for the five surgical specialties, overall and by domain, was assessed using χ2 tests; P < 0.05 was deemed statistically significant. Pairwise differences in the probability of non‐technical errors, overall and by domain, were assessed in multivariable binary logistic regression models; we report adjusted odds ratios (aOR) with 95% confidence intervals (CI); P < 0.005 was deemed statistically significant (Bonferroni correction for ten pairwise analyses).
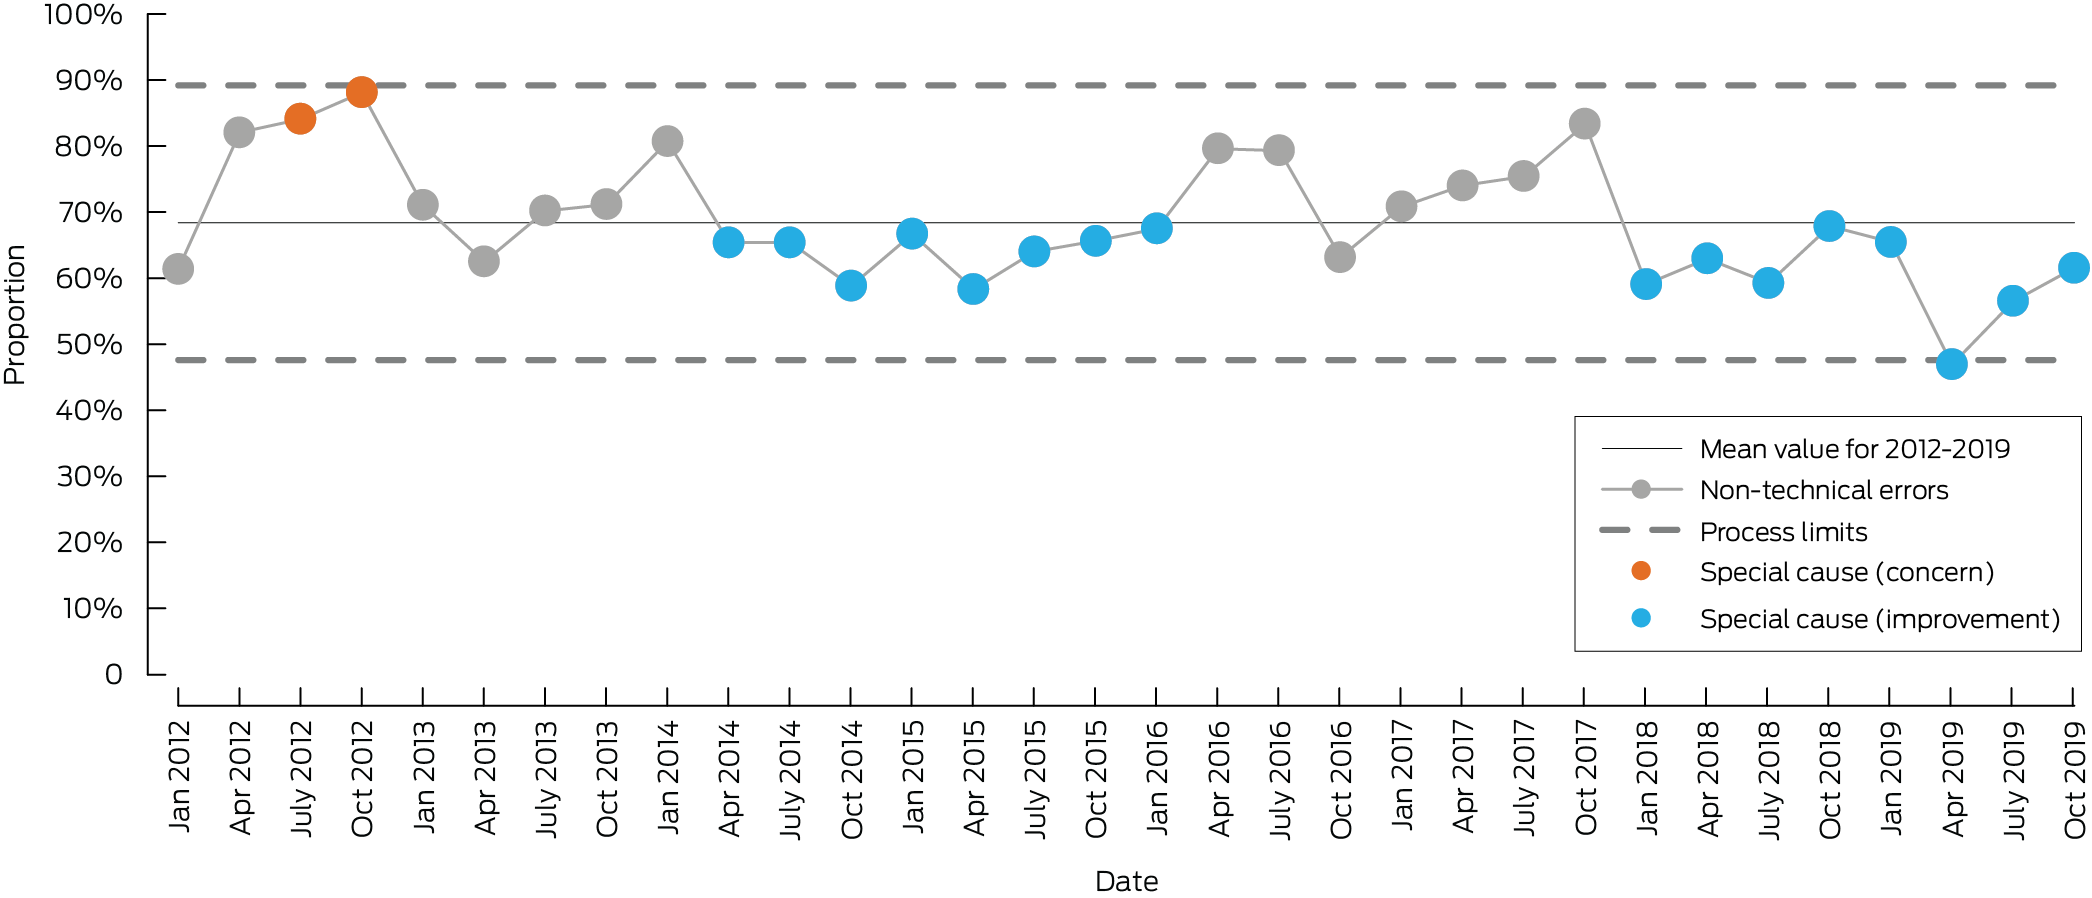
Change over time in overall non‐technical error rate by specialty was assessed using standardised process control (SPC) charts. SPC charts of longitudinal data include the mean (centre line) and control limits (± three sigma [approximately: standard deviations]), thereby distinguishing common cause variation (random fluctuation within process limits) from special cause variation (non‐random change). Special cause variation was identified using established rules: a data point outside the upper or lower control limits; two of three successive data points more than two sigma above or below the mean; six or more successive data points above or below the mean; or six or more consecutive points with the same direction of change. Special cause variation was defined as “concern” if the change was above the mean and “improvement” if below the mean. Not all special cause variation reflects a shift in underlying performance: isolated or transient signals can indicate unusual but temporary events, whereas sustained directional patterns indicate genuine process change.13
The influence of patient (sex; private, public or veteran) and admission factors (elective or emergency; private or public hospital) on non‐technical error proportion was assessed using descriptive statistics and multivariable binary logistic regression analyses; we report aORs with 95% CIs; P < 0.05 was deemed statistically significant. Statistical analyses were conducted in SAS 9.4.
Ethics approval
We did not seek formal ethics approval for our quality assurance and evaluation activity, as defined by the National Health and Medical Research Council.14 ANZASM clinical directors and RACS approved the study prior to its commencement.
Results
During 2012–2019, 30 971 surgical care‐related deaths were reported to ANZASM, of which 3695 were flagged with adverse events or areas of concern. A total of 3422 cases (92.6%) were from five surgical specialties: general surgery (1570 deaths), cardiothoracic surgery (626), orthopaedic surgery (510), vascular surgery (385), and neurosurgery (331). The case numbers for other surgical specialties (urology, 138; plastic surgery, 58; otolaryngology, 39; obstetrics/gynaecology, 24; oral/maxillofacial surgery, five; paediatric surgery, five; ophthalmology, four) were insufficient for meaningful comparative analyses (non‐technical errors for these specialties: Supporting Information, table 1). The following analyses are restricted to the five specialties with the highest case numbers.
Overall inter‐rater agreement regarding the identification of non‐technical errors in the flagged ANZASM cases using SICNESS was good for all specialties; disagreement required a third reviewer in 172 of 3695 cases (4.7%).
The proportions of surgical care‐related deaths associated with any non‐technical error differed between the five specialties (range, 52.2% to 68.5%), and also for the domains decision making (range, 52.6% to 66.3%) and situational awareness errors (range, 44.4% to 62.5%). The differences between specialties in the proportions for communication/teamwork and leadership errors were not statistically significant (Box 1).
The probability of any non‐technical error was greater for cardiothoracic than orthopaedic surgery (aOR, 1.76; 95% CI, 1.37–2.28), and for general than orthopaedic surgery (aOR, 1.97; 95% CI, 1.59–2.44) or neurosurgery (aOR, 1.47; 95% CI, 1.14–1.90); the probability was lower for orthopaedic than vascular surgery (aOR, 0.54; 95% CI, 0.41–0.72). The probability of a decision making error was higher for cardiothoracic than orthopaedic surgery (aOR, 1.74; 95% CI, 1.24–2.43). The probability of a situational awareness error was lower for cardiothoracic than general surgery (aOR, 0.60; 95% CI, 0.47–0.77), higher for general surgery than neurosurgery (aOR, 2.49; 95% CI, 1.79–3.47), and lower for neurosurgery than orthopaedic (aOR, 0.44; 95% CI, 0.30–0.66) or vascular surgery (aOR, 0.51; 95% CI, 0.34–0.76). The probability of communication/teamwork or leadership errors did not statistically differ between specialties (Box 2).
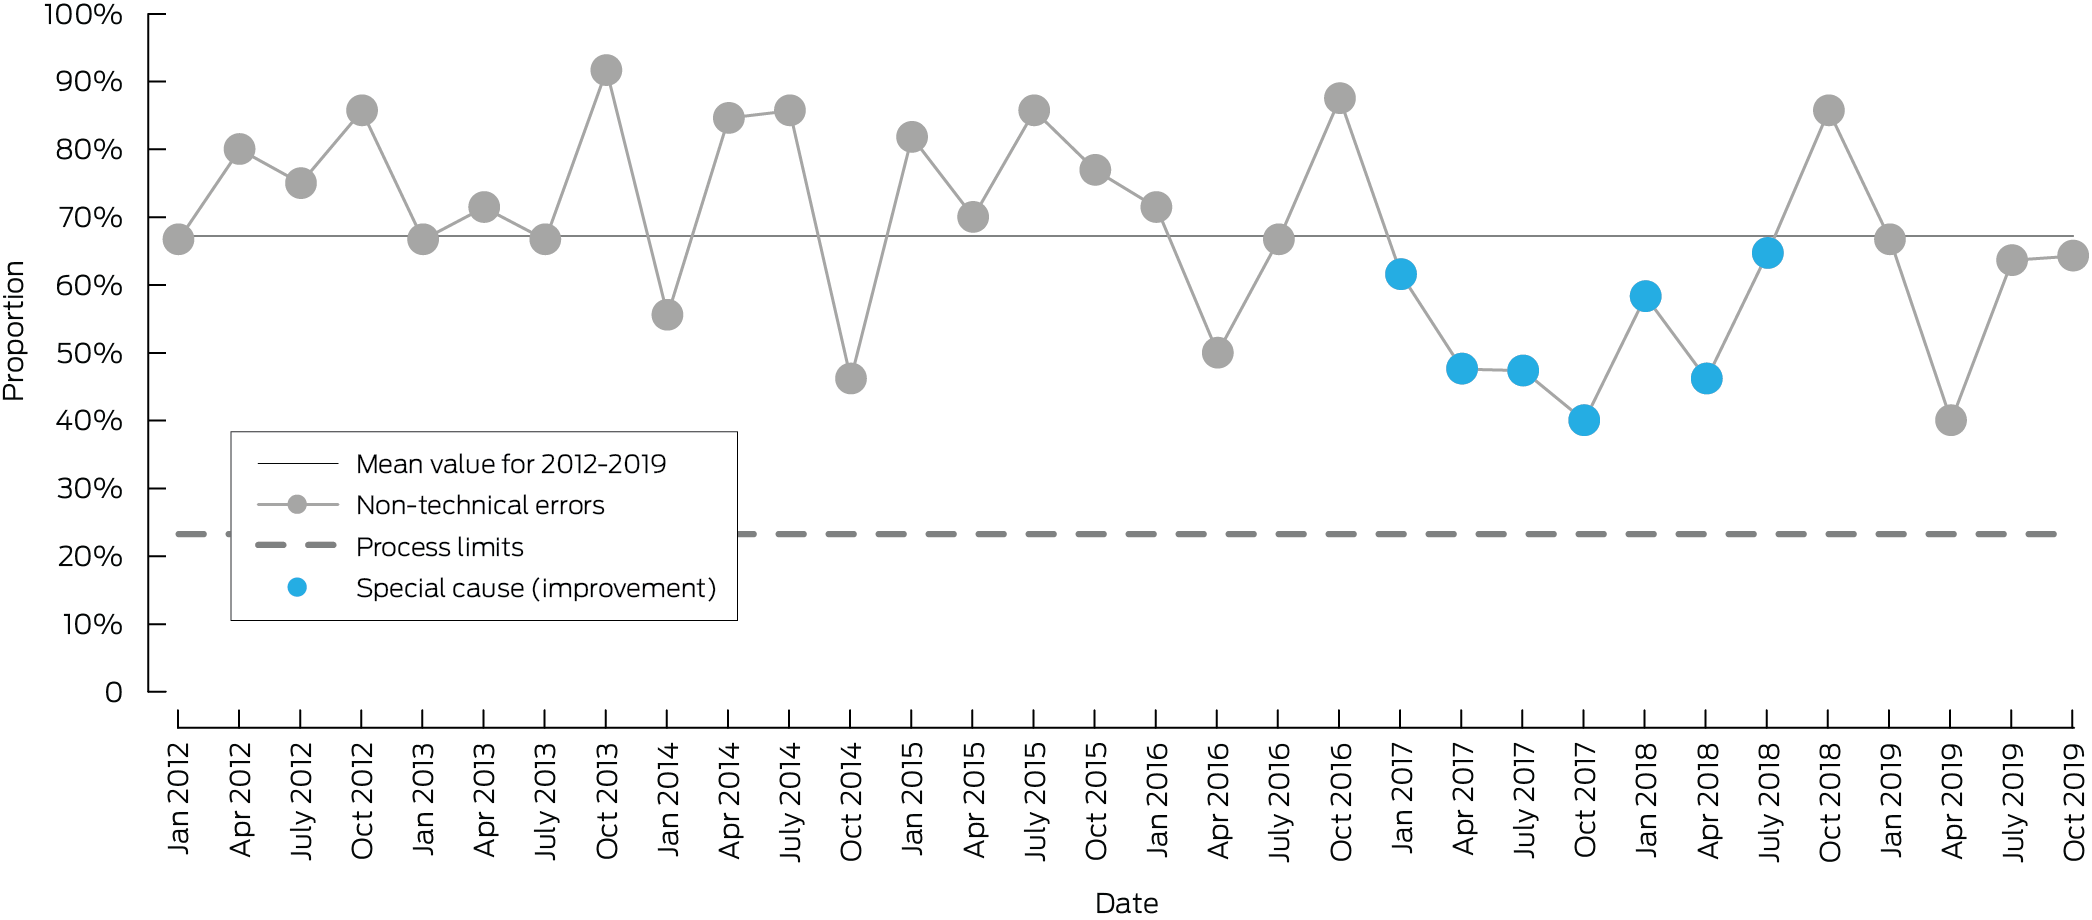
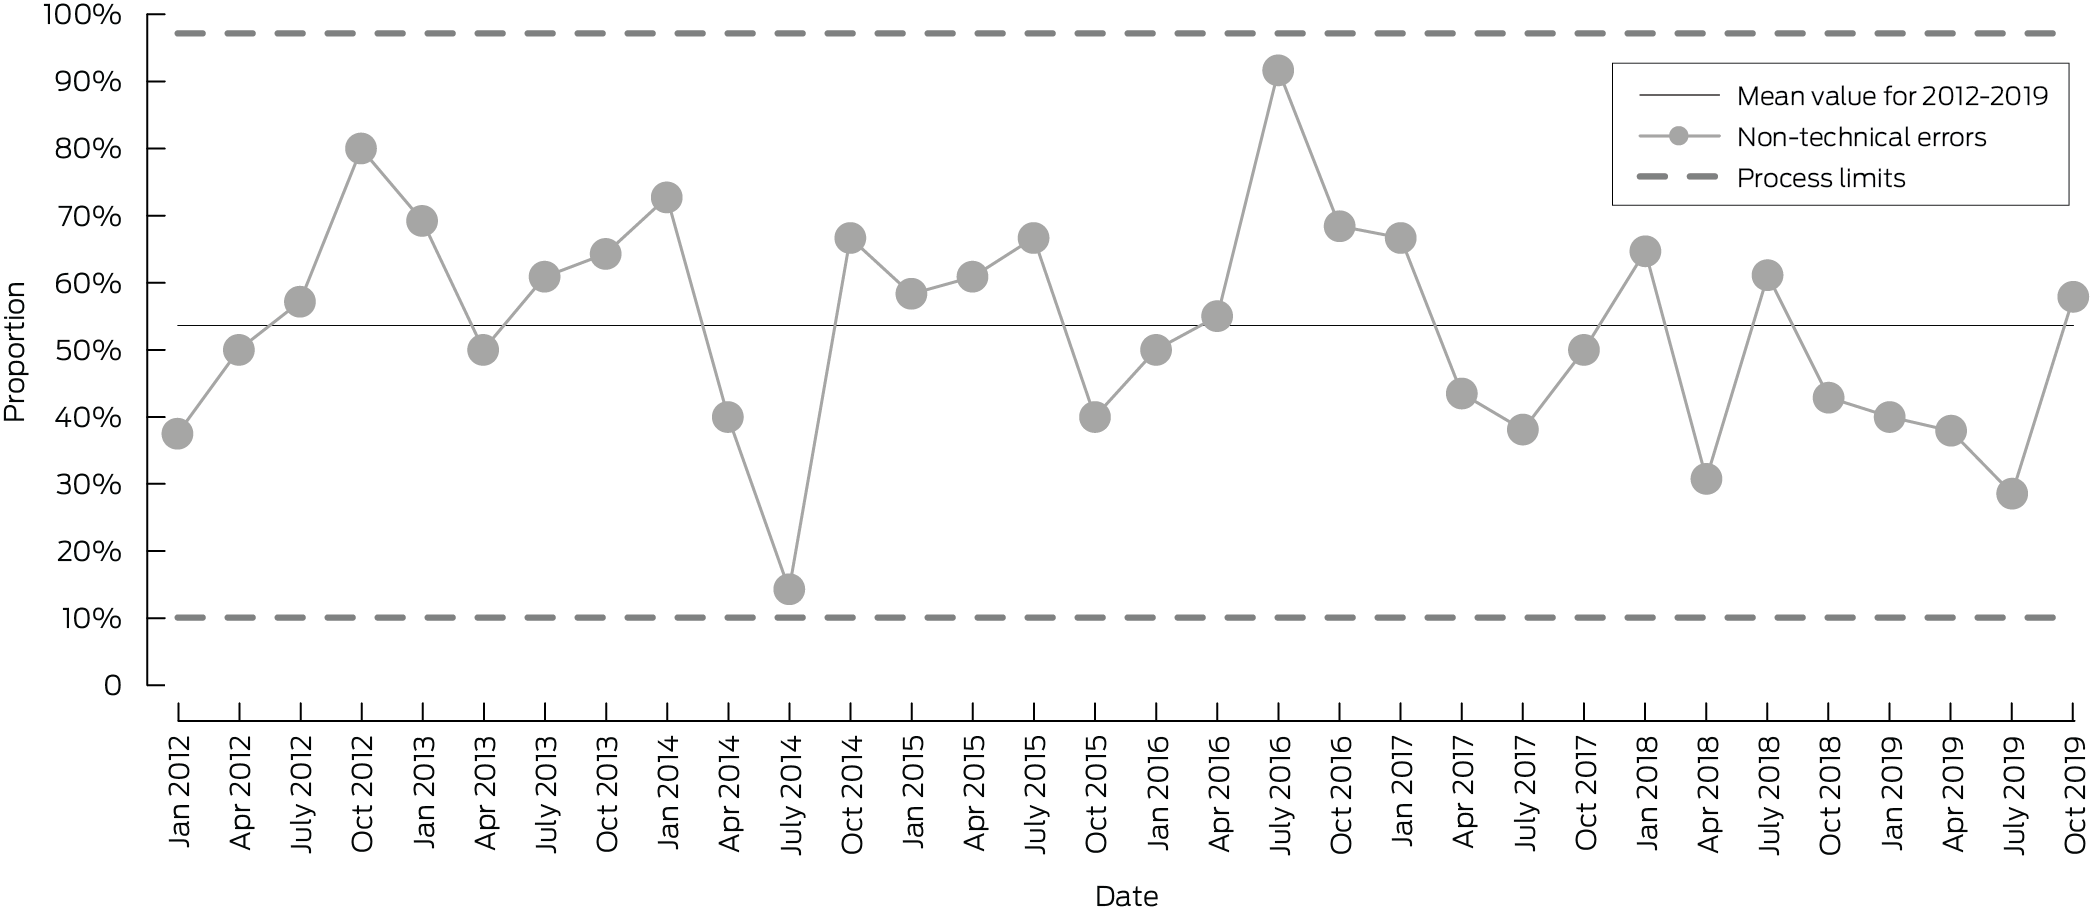
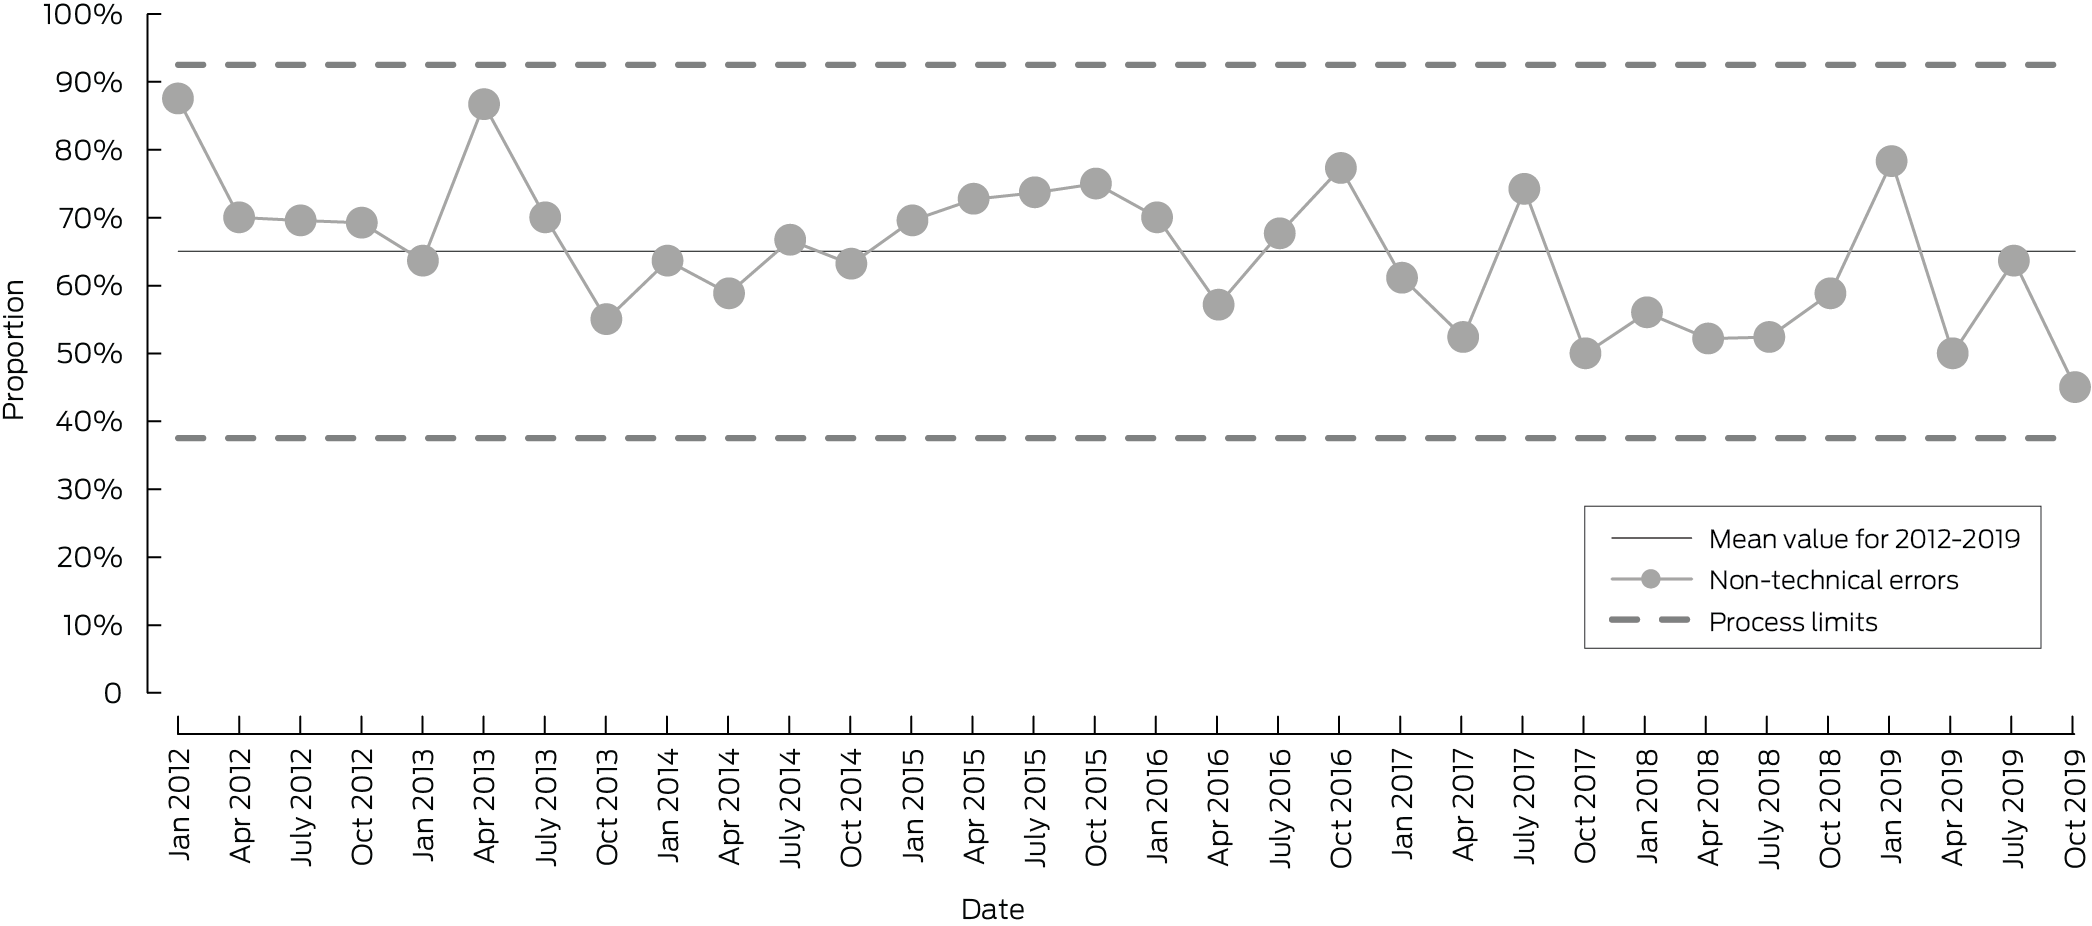
The proportion of general surgery‐related deaths associated with non‐technical errors declined over time (two periods of special cause improvement). The proportion increased during January–October 2012, but was smaller than the mean proportion for 2012–2019 during April 2014 – January 2016 and January 2018 – October 2019 (Box 3). The proportion of vascular surgery‐related deaths associated with non‐technical errors was lower than the mean proportion for 2012–2019 during January 2017 – July 2018, but did not meet the criterion for overall special cause improvement (Box 4). No periods of special cause variation were identified for orthopaedic surgery (Box 5), neurosurgery (Box 6), or cardiothoracic surgery (Box 7).
Differences by patient and admission characteristics in the proportions of cases including non‐technical errors were not statistically significant for any surgical specialty (Box 8).
Discussion
We compared the frequency of non‐technical errors associated with surgical care‐related deaths in five surgical specialties in Australia. More than half the surgical care‐related deaths in each of the five specialties were associated with non‐technical errors. The error proportions (both overall and specific types) and changes in the overall error proportion over time differed between the surgical specialties.
The most frequent error type differed between specialties. For both general and orthopaedic surgery, situational awareness errors were more frequent than decision making errors; for vascular surgery, cardiothoracic surgery, and neurosurgery, decision making errors were more frequent than situational awareness errors. These findings are in keeping with those of other studies.4,5,7,8,15 Communication/teamwork and leadership errors were associated with substantially fewer deaths in all five specialties. Errors in decision making and situational awareness should therefore be considered priority areas for non‐technical skill improvement by surgical training organisations, regardless of specialty.
During 2012–2019, the proportion of surgical care‐related deaths associated with fatal non‐technical errors did not change significantly for four of five specialties, the exception being the decline for general surgery. However, the overall fatal non‐technical error proportion was largest for general surgery, and was at least 60% for six of eight quarters during 2018–2019, similar to the mean overall proportion during 2012–2019 for cardiothoracic surgery, neurosurgery, and vascular surgery. These findings indicate that current strategies for improving non‐technical skills are insufficient.
Despite differences between specialties, the persistently high proportion of surgical care‐related deaths associated with non‐technical errors suggests that systemwide improvement should be preferred to specialty‐specific interventions. Patient characteristics, diagnoses, procedures, and surgical risk differ by specialty, each of which may affect the likelihood of non‐technical errors and perceptions of preventability. For example, 255 of 510 deaths in orthopaedic surgery (50%) were related to hip fractures, which are frequently managed with palliative intent; the fact that death is expected in such cases may influence the perceived preventability of non‐technical errors, with implications for reflective practice. These errors should nevertheless be investigated, as their impact on the duration and quality of life of the patient is unknown. The impact of specialty‐specific non‐technical errors must be investigated if improvement strategies are to be effective.
The importance of surgical non‐technical skills in Australia was discussed in an MJA editorial in 2013; the author argued that both national and specialty‐specific non‐technical skills education was needed to avert future harm.16 At that time, opportunities for non‐technical skills education and improvement were available through the RACS in the form of didactic and workshop courses, including one based on the Non‐Technical Skills for Surgeons Manual (NOTSS) and the Training in Professional Skills (TIPS) course.16 However, delivering these courses was difficult because of the required infrastructure, the limited availability of expert educators, and the number of courses required to reach all surgeons. Despite the anticipated impact of non‐technical skills training, the NOTSS course was discontinued in 2020.2,17
Other approaches to improving non‐technical skills in surgical practice include local clinical audits, morbidity and mortality meetings, and sentinel event reviews. These strategies enable identification of non‐technical skill deficiencies and facilitate reflective practice, but their effectiveness depends on individual surgeon engagement and institutional processes. Further, these approaches are not standardised, are inconsistently available, and our findings indicate that they have not markedly contributed to reducing the frequency of fatal non‐technical errors.
ANZASM could contribute to improving non‐technical skills in surgery, but it was not explicitly designed for this purpose. Its primary objective is to improve patient outcomes through education, achieved in two ways. First, during the audit process the first or second line assessor determine whether non‐technical skill deficiencies were apparent, and this information can be communicated to the surgeon involved.12 Second, education is provided more broadly by publishing and disseminating anonymised review outcomes and peer‐reviewed research findings based on ANZASM data.18,19,20,21,22
The ANZASM has recorded a progressive, consistent fall in standardised mortality ratios for people receiving surgical care in Australian states during 2016–2021.23 We have previously attributed the decline in non‐technical errors across all surgical specialties during 2012–2019 to the ANZASM process.9 However, the proportion of surgical care‐related deaths associated with non‐technical errors remains high, and we found no reduction in the two most frequent error types. Other than a small decline for general surgery, the overall improvement is not reflected in changes at the specialty level. While ANZASM is effective for driving non‐technical skills change at the national level, it cannot meaningfully reduce fatal non‐technical error rates, particularly at the specialty level.
The ANZASM infrastructure could be used to lead improvements in surgical non‐technical skills. As a national system covering all practising surgeons, it does not have the logistical problems of standalone non‐technical skills training programs. Incorporating a validated, standardised assessment tool, such as the SICNESS, into ANZASM would facilitate evaluating every surgical death for non‐technical errors and providing feedback to all surgeons who report such deaths, fostering individual professional reflection and growth. It would also facilitate the prospective collection of non‐technical error‐related data at the national and specialty levels that would be invaluable for determining the incidence of non‐technical errors. This information could be disseminated to the broader surgical community for educational purposes and for monitoring the effectiveness of non‐technical skills improvement strategies.
To avert preventable patient deaths, surgical training organisations must develop or adopt evidence‐based strategies that provide surgeons with opportunities for non‐technical skills improvement. Non‐technical skills can be improved using various strategies, including checklists and practice with debriefing.24,25,26,27,28,29,30,31,32,33 However, tailored approaches are needed not only for each specialty, but for different scenarios within specialties. Coaching, one improvement method often employed in high performance professions, is based on individual or group goal setting and can therefore be tailored to specialty‐specific priorities. Coaching can be feasible and effective for improving non‐technical skills, and technological advances mean that it can be provided remotely, making it available for all surgeons, including those in rural and remote areas.29,30,31,34
Non‐technical skills are not unique to surgery; good communication, decision making, situational awareness, and leadership are essential in all medical specialties. In non‐surgical disciplines, communication and teamwork failures contribute to one‐quarter of hospital safety incidents and are the sole cause in about 10% of cases.35 We focused in this study on surgical specialties, but responsibility for surgical care is shared by multidisciplinary teams, including anaesthetics, emergency medicine, and intensive care practitioners. The degree to which non‐surgical teams are involved in the surgical care errors, and the degree to which they could be involved in their prevention, should be investigated.
In industries in which safety is a critical factor, deaths and major errors are usually investigated by independent external bodies. Medical deaths, in contrast, are usually reviewed by coroners, with limited external oversight. One strength of our study was that non‐technical errors were identified by multiple independent assessments: initial and secondary expert reviews during the ANZASM process, followed by independent analysis by researchers using the SICNESS, a validated expert‐developed tool.
Limitations
Our analysis was limited to the five specialties with high numbers of surgical care‐related deaths, which may limit the generalisability of our findings to specialties with fewer deaths. However, the included specialties included 92.6% of surgical care‐related deaths in Australia during 2012–2019. The absence of data from New South Wales, the most populous Australian state, could also affect the generalisability of our findings; however, surgery across Australia is overseen by RACS, and similar surgical standards and practices make major differences unlikely. Further, we included only cases in which people receiving surgical care died, a subset of all patients; our findings may therefore not be generalisable to specialties with lower mortality rates. Non‐fatal non‐technical errors require further investigation. Finally, while each included case was associated with a specific surgeon, team, and hospital, our statistical analyses assumed that cases were independent. The data we analysed were deidentified, preventing the identification of individuals or institutions and limiting the ability to adjust our analyses for clustering; this may have led to underestimation of variance and increased the risk of type I error. However, the dataset comprises a near complete national cohort of surgical care‐related deaths, and the large sample size made χ2 analyses with standard asymptotic assumptions appropriate.
Conclusions
Inadequate surgical non‐technical skills can have fatal consequences. Despite differences between surgical specialties in the frequency of non‐technical errors, at least 50% of surgical care‐related deaths were associated with such errors in the five specialties we examined, and these proportions had not substantially changed during 2012–2019. Improving non‐technical skills should be a priority for Australian surgery. Establishing specialty‐specific priorities and identifying evidence‐based non‐technical skill improvement initiatives will require further research.
Data availability
The de‐identified data analysed in this study are not publicly available, but requests to the corresponding author for the data will be considered on a case‐by‐case basis.
Box 1 – Non‐technical errors identified in 3422 deaths in five surgical specialties, Australia (except New South Wales), 2012–2019, overall and by non‐technical skill domain*
|
Technical skill domain |
General surgery |
Vascular surgery |
Neurosurgery |
Orthopaedic surgery |
Cardiothoracic surgery |
P † |
|||||||||
|
|
|||||||||||||||
|
Any non‐technical error |
1075/1570 (68.5%) |
256/385 (66.5%) |
198/331 (59.8%) |
266/510 (52.2%) |
404/626 (64.5%) |
< 0.001 |
|||||||||
|
Communication/teamwork |
169 [15.7%] |
36 [14.1%] |
25 [12.6%] |
40 [15.0%] |
59 [14.6%] |
0.80 |
|||||||||
|
Decision making |
601 [55.9%] |
153 [59.8%] |
122 [61.6%] |
140 [52.6%] |
268 [66.3%] |
0.001 |
|||||||||
|
Situational awareness |
672 [62.5%] |
139 [54.3%] |
88 [44.4.%] |
151 [56.8%] |
198 [49.0%] |
< 0.001 |
|||||||||
|
Leadership |
70 [6.5%] |
11 [4.3%] |
6 [3.0%] |
17 [6.4%] |
15 [3.7%] |
0.08 |
|||||||||
|
|
|||||||||||||||
|
* For any non‐technical error, the denominator is the number of included cases of surgical care‐related death; or individual domains, the denominator is the number of cases in the specialty that included any non‐technical errors. † χ2 test for proportions in the five specialties. |
|||||||||||||||
Box 2 – Non‐technical errors identified in deaths in five surgical specialties, Australia (except New South Wales), 2012–2019, overall and by non‐technical skill domain: multivariable binary logistic analyses
|
Outcome |
Adjusted odds ratio (95% CI) |
P* |
|||||||||||||
|
|
|||||||||||||||
|
Any non‐technical error |
|
|
|||||||||||||
|
Cardiothoracic v general |
0.90 (0.73–1.10) |
0.29 |
|||||||||||||
|
Cardiothoracic v neurosurgery |
1.32 (0.99–1.76) |
0.06 |
|||||||||||||
|
Cardiothoracic v orthopaedic |
1.76 (1.37–2.28) |
< 0.001 |
|||||||||||||
|
Cardiothoracic v vascular |
0.96 (0.73–1.27) |
0.77 |
|||||||||||||
|
General v neurosurgery |
1.47 (1.14–1.90) |
0.003 |
|||||||||||||
|
General v orthopaedic |
1.97 (1.59–2.44) |
< 0.001 |
|||||||||||||
|
General v vascular |
1.07 (0.84–1.37) |
0.58 |
|||||||||||||
|
Neurosurgery v orthopaedic |
1.34 (0.99–1.81) |
0.05 |
|||||||||||||
|
Neurosurgery v vascular |
0.73 (0.53–1.00) |
0.05 |
|||||||||||||
|
Orthopaedic v vascular |
0.54 (0.41–0.72) |
< 0.001 |
|||||||||||||
|
Communication/teamwork error |
|
|
|||||||||||||
|
Cardiothoracic v general |
1.04 (0.74–1.46) |
0.82 |
|||||||||||||
|
Cardiothoracic v neurosurgery |
1.27 (0.75–2.15) |
0.37 |
|||||||||||||
|
Cardiothoracic v orthopaedic |
1.00 (0.63–1.59) |
0.99 |
|||||||||||||
|
Cardiothoracic v vascular |
1.05 (0.67–1.66) |
0.83 |
|||||||||||||
|
General v neurosurgery |
1.22 (0.76–1.97) |
0.41 |
|||||||||||||
|
General v orthopaedic |
0.96 (0.65–1.43) |
0.85 |
|||||||||||||
|
General v vascular |
1.01 (0.68–1.51) |
0.95 |
|||||||||||||
|
Neurosurgery v orthopaedic |
0.79 (0.44–1.40) |
0.42 |
|||||||||||||
|
Neurosurgery v vascular |
0.83 (0.47–1.47) |
0.52 |
|||||||||||||
|
Orthopaedic v vascular |
1.05 (0.64–1.74) |
0.84 |
|||||||||||||
|
Decision making error |
|
|
|||||||||||||
|
Cardiothoracic v general |
1.35 (1.05–1.73) |
0.02 |
|||||||||||||
|
Cardiothoracic v neurosurgery |
0.98 (0.67–1.42) |
0.92 |
|||||||||||||
|
Cardiothoracic v orthopaedic |
1.74 (1.24–2.43) |
0.001 |
|||||||||||||
|
Cardiothoracic v vascular |
1.29 (0.92–1.80) |
0.15 |
|||||||||||||
|
General v neurosurgery |
0.73 (0.52–1.01) |
0.06 |
|||||||||||||
|
General v orthopaedic |
1.29 (0.97–1.71) |
0.08 |
|||||||||||||
|
General v vascular |
0.96 (0.72–1.27) |
0.75 |
|||||||||||||
|
Neurosurgery v orthopaedic |
1.77 (1.18–2.66) |
0.01 |
|||||||||||||
|
Neurosurgery v vascular |
1.32 (0.88–1.97) |
0.18 |
|||||||||||||
|
Orthopaedic v vascular |
0.74 (0.52–1.06) |
0.12 |
|||||||||||||
|
Situational awareness error |
|
|
|||||||||||||
|
Cardiothoracic v general |
0.60 (0.47–0.77) |
< 0.001 |
|||||||||||||
|
Cardiothoracic v neurosurgery |
1.50 (1.04–2.17) |
0.03 |
|||||||||||||
|
Cardiothoracic v orthopaedic |
0.67 (0.48–0.93) |
0.02 |
|||||||||||||
|
Cardiothoracic v vascular |
0.77 (0.55–1.06) |
0.11 |
|||||||||||||
|
General v neurosurgery |
2.49 (1.79–3.47) |
< 0.001 |
|||||||||||||
|
General v orthopaedic |
1.11 (0.83–1.47) |
0.48 |
|||||||||||||
|
General v vascular |
1.27 (0.95–1.69) |
0.10 |
|||||||||||||
|
Neurosurgery v orthopaedic |
0.44 (0.30–0.66) |
< 0.001 |
|||||||||||||
|
Neurosurgery v vascular |
0.51 (0.34–0.76) |
< 0.001 |
|||||||||||||
|
Orthopaedic v vascular |
1.14 (0.80–1.64) |
0.46 |
|||||||||||||
|
Leadership error |
|
|
|||||||||||||
|
Cardiothoracic v general |
0.65 (0.36–1.17) |
0.15 |
|||||||||||||
|
Cardiothoracic v neurosurgery |
1.34 (0.50–3.57) |
0.56 |
|||||||||||||
|
Cardiothoracic v orthopaedic |
0.63 (0.30–1.32) |
0.22 |
|||||||||||||
|
Cardiothoracic v vascular |
0.93 (0.42–2.08) |
0.86 |
|||||||||||||
|
General v neurosurgery |
2.06 (0.86–4.94) |
0.10 |
|||||||||||||
|
General v orthopaedic |
0.97 (0.54–1.72) |
0.91 |
|||||||||||||
|
General v vascular |
1.43 (0.74–2.77) |
0.28 |
|||||||||||||
|
Neurosurgery v orthopaedic |
0.47 (0.17–1.26) |
0.13 |
|||||||||||||
|
Neurosurgery v vascular |
0.70 (0.25–1.96) |
0.49 |
|||||||||||||
|
Orthopaedic v vascular |
1.48 (0.67–3.30) |
0.33 |
|||||||||||||
|
|
|||||||||||||||
|
CI = confidence interval. * P < 0.005 deemed statistically significant (Bonferroni correction). |
|||||||||||||||
Box 3 – Proportion of general surgery‐related deaths in which non‐technical errors were identified, Australia (except New South Wales), 2012–2019
Box 4 – Proportion of vascular surgery‐related deaths in which non‐technical errors were identified, Australia (except New South Wales), 2012–2019
Box 5 – Proportion of orthopaedic surgery‐related deaths in which non‐technical errors were identified, Australia (except New South Wales), 2012–2019
Box 6 – Proportion of neurosurgery‐related deaths in which non‐technical errors were identified, Australia (except New South Wales), 2012–2019
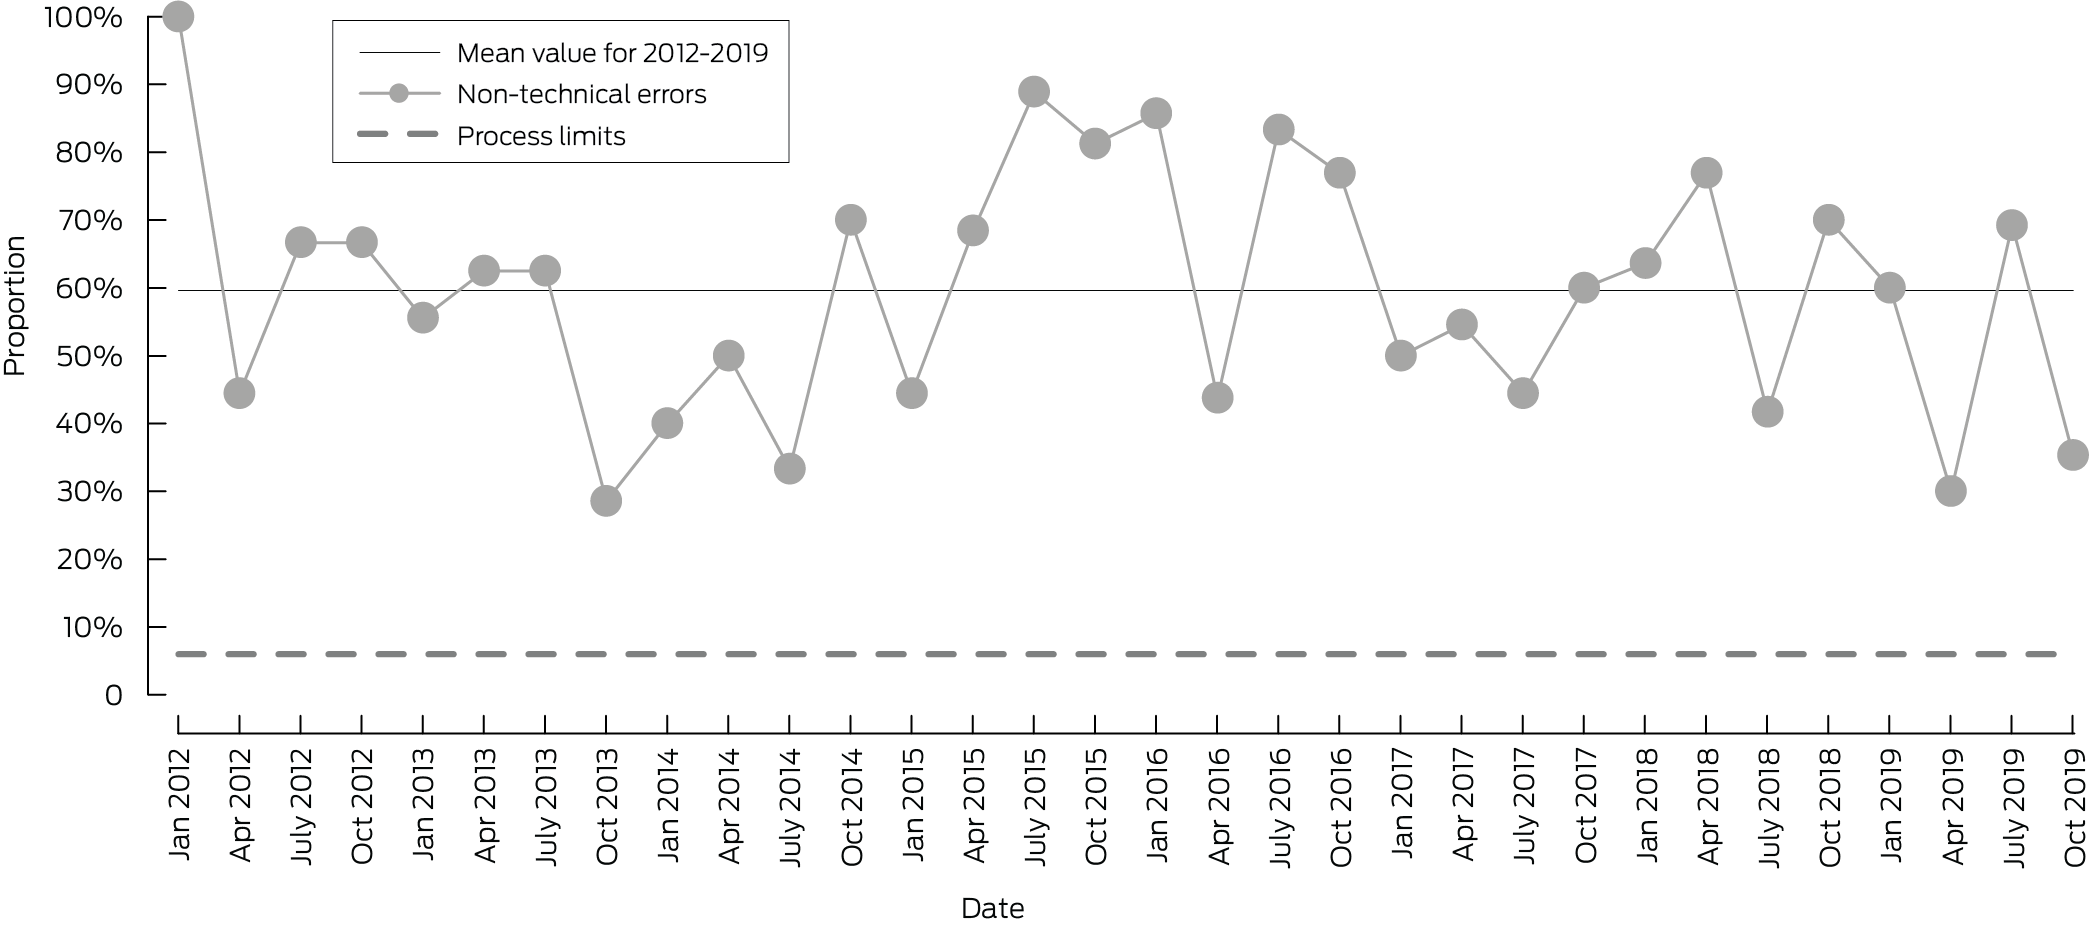
Box 7 – Proportion of cardiothoracic surgery‐related deaths in which non‐technical errors were identified, Australia (except New South Wales), 2012–2019
Box 8 – Non‐technical errors identified in surgical care‐related deaths for five surgical specialties, Australia (except New South Wales), 2012–2019, by patient and admission characteristics: multivariable binary logistic analyses*
|
Characteristic |
Adjusted odds ratio (95% CI) |
P |
|||||||||||||
|
|
|||||||||||||||
|
General surgery |
|
|
|||||||||||||
|
Elective v emergency admission |
1.22 (0.93–1.59) |
0.15 |
|||||||||||||
|
Private v public hospitals |
0.62 (0.36–1.06) |
0.08 |
|||||||||||||
|
Male v female patients |
0.88 (0.70–1.10) |
0.26 |
|||||||||||||
|
Patient status |
|
|
|||||||||||||
|
Private v public |
1.12 (0.69–1.84) |
0.64 |
|||||||||||||
|
Private v veteran |
0.66 (0.17–2.52) |
0.54 |
|||||||||||||
|
Public v veteran |
0.58 (0.16–2.19) |
0.43 |
|||||||||||||
|
Vascular surgery |
|
|
|||||||||||||
|
Elective v emergency admission |
0.71 (0.45–1.14) |
0.16 |
|||||||||||||
|
Male v female patients |
1.24 (0.79–1.93) |
0.35 |
|||||||||||||
|
Private v public hospitals |
0.38 (0.11–1.29) |
0.12 |
|||||||||||||
|
Patient status |
|
|
|||||||||||||
|
Private v public |
2.31 (0.71–7.55) |
0.16 |
|||||||||||||
|
Private v veteran |
1.86 (0.28–12.61) |
0.52 |
|||||||||||||
|
Public v veteran |
0.81 (0.11–6.02) |
0.83 |
|||||||||||||
|
Neurosurgery |
|
|
|||||||||||||
|
Elective v emergency admission |
0.81 (0.44–1.50) |
0.50 |
|||||||||||||
|
Private v public hospitals |
1.28 (0.31–5.38) |
0.73 |
|||||||||||||
|
Male v female patients |
1.09 (0.69–1.72) |
0.72 |
|||||||||||||
|
Patient status |
|
|
|||||||||||||
|
Private v public |
1.14 (0.29–4.43) |
0.86 |
|||||||||||||
|
Cardiothoracic surgery |
|
|
|||||||||||||
|
Elective v emergency admission |
0.94 (0.67–1.33) |
0.74 |
|||||||||||||
|
Private v public hospitals |
0.95 (0.41–2.17) |
0.90 |
|||||||||||||
|
Male v female patients |
0.88 (0.62–1.25) |
0.47 |
|||||||||||||
|
Patient status |
Insufficient data† |
|
|||||||||||||
|
Orthopaedic surgery |
|
|
|||||||||||||
|
Elective v emergency admission |
1.41 (0.85–2.37) |
0.19 |
|||||||||||||
|
Private v public hospitals |
2.49 (1.07–5.82) |
0.034 |
|||||||||||||
|
Male v female patients |
0.98 (0.68–1.41) |
0.92 |
|||||||||||||
|
Patient status |
|
|
|||||||||||||
|
Private v public |
0.53 (0.23–1.18) |
0.12 |
|||||||||||||
|
Private v veteran |
0.35 (0.10–1.20) |
0.09 |
|||||||||||||
|
Public v veteran |
0.66 (0.20–2.16) |
0.50 |
|||||||||||||
|
|
|||||||||||||||
|
CI = confidence interval. * The proportions by each characteristic are reported for each specialty in the Supporting Information, table 2. † Model did not converge because of insufficient number of outcome events. |
|||||||||||||||
Received 24 April 2025, accepted 25 August 2025
- Jesse Ey1,2
- Victoria Kollias2
- Octavia Lee2
- Kelly Hou2
- Matheesha Herath1
- John B North3
- Ellie Treloar1
- Suzanne Edwards2
- Martin Bruening1
- Adam J Wells4
- Guy J Maddern2
- 1 The Queen Elizabeth Hospital, Adelaide, SA
- 2 The University of Adelaide, Adelaide, SA
- 3 Princess Alexandra Hospital, Brisbane, QLD
- 4 Royal Adelaide Hospital, Adelaide, SA
Open access:
Open access publishing facilitated by the University of Adelaide, as part of the Wiley – the University of Adelaide agreement via the Council of Australian University Librarians.
Jesse Ey and Ellie Treloar hold University of Adelaide Research Training Program scholarships and Basil Hetzel Institute Higher Degree top‐up scholarships. Matheesha Herath holds a University of Adelaide Research Training Program scholarship, a South Australian Hospital Research Foundation higher degree scholarship, and a Basil Hetzel Institute higher degree top‐up scholarship. No industry or other funding was received for this study. The data analysed were collected, collated, and paid for by the Royal Australasian College of Surgeons. The funding sources had no role or influence at any stage of the study.
No relevant disclosures.
Authors’ contributions:
J Ey: conceptualisation, project administration, data curation, methodology, investigation, formal analysis, writing (original); V Kollias: conceptualisation methodology, data curation, investigation, writing (review and editing); O Lee: data curation, methodology, investigation, writing (review and editing); Kelly Hou: data curation, investigation, writing (review and editing); M Herath: data curation, investigation, writing (review and editing); J North: investigation, methodology, writing (review and editing); E Treloar: formal analysis, writing (review and editing); S Edwards: formal analysis, writing (review and editing); M Bruening: supervision, conceptualisation, writing (review and editing); A Wells: supervision, conceptualisation, writing (review and editing); G Maddern: supervision, conceptualisation, methodology, writing (review and editing).
- 1. Ey JD, Kollias V, Herath MB, et al. Development and validation of a novel tool for identification and categorization of non‐technical errors associated with surgical mortality. Br J Surg 2024; 111: znae253.
- 2. Yule S, Flin R, Paterson‐Brown S, et al. Development of a rating system for surgeons’ non‐technical skills. Med Educ 2006; 40: 1098‐1104.
- 3. Anderson O, Davis R, Hanna GB, Vincent CA. Surgical adverse events: a systematic review. Am J Surg 2013; 206: 253‐262.
- 4. Rogers SO, Gawande AA, Kwaan M, et al. Analysis of surgical errors in closed malpractice claims at 4 liability insurers. Surgery 2006; 140: 25‐33.
- 5. Gawande AA, Zinner MJ, Studdert DM, Brennan TA. Analysis of errors reported by surgeons at three teaching hospitals. Surgery 2003; 133: 614‐621.
- 6. Murshed I, Gupta AK, Camilos AN, et al. Surgical interhospital transfer mortality: national analysis. Br J Surg 2023; 110: 591‐598.
- 7. Gupta AK, Stewart SK, Cottell K, et al. Potentially avoidable issues in urology mortality cases in Australia: identification and improvements. ANZ J Surg 2020; 90: 719‐724.
- 8. Gupta AK, Stewart SK, Cottell K, et al. Potentially avoidable issues in neurosurgical mortality cases in Australia: identification and improvements. ANZ J Surg 2017; 87: 86‐91.
- 9. Ey JD, Kollias V, Lee O, et al. Non‐technical error leading to patient fatalities in the Australian surgical population. Br J Surg 2025; 112: znaf083.
- 10. von Elm E, Altman DG, Egger M, et al; STROBE Initiative. The strengthening the reporting of observational studies in epidemiology (STROBE) statement: guidelines for reporting observational studies. Lancet 2007; 370: 1453‐1457.
- 11. Raju RS, Guy GS, Majid AJ, et al. The Australian and New Zealand Audit of Surgical Mortality: birth, deaths, and carriage. Ann Surg 2015; 26: 304‐308.
- 12. Royal Australasian College of Surgeons. Australian and New Zealand Audit of Surgical Mortality national report. ANZASM national report 2021–2022. https://www.surgeons.org/‐/media/Project/RACS/surgeons‐org/files/surgical‐mortality‐audits/anzasm‐reports/2025‐01‐30‐ANZASM‐National‐Report‐2021‐2022.pdf?rev=bc258712914445a3b017b55b0623b381&hash=7B4CD76E1997729CAFB3E6269DF3AE76 (viewed Apr 2025).
- 13. Benneyan JC, Lloyd RC, Plsek PE. Statistical process control as a tool for research and healthcare improvement. Qual Saf Health Care 2003; 12: 458‐464.
- 14. National Health and Medical Research Council. Ethical considerations in quality assurance and evaluation activities. Mar 2014. https://www.nhmrc.gov.au/about‐us/publications/ethical‐considerations‐quality‐assurance‐and‐evaluation‐activities (viewed Apr 2025).
- 15. Scottish Audit of Surgical Mortality. Annual report 2010. Reporting on 2009 data. https://www.sasm.scot.nhs.uk/Publications/SASM_Annual_Report_2010.pdf (viewed Apr 2025).
- 16. Hollands MJ. Providing non‐technical skills for surgeons. Med J Aust 2013; 198: 400‐401. https://www.mja.com.au/journal/2013/198/8/providing‐non‐technical‐skills‐surgeons
- 17. Pena G, Altree M, Field J, et al. Nontechnical skills training for the operating room: a prospective study using simulation and didactic workshop. Surgery 2015; 158: 300‐309.
- 18. Royal Australasian College of Surgeons. Australian and New Zealand Audits of Surgical Mortality: national case note review booklet. Lessons from the audit, volume 30: complex surgery/technical problems. Nov 2024. https://issuu.com/maxgecko/docs/anzasm_case_note_review_booklet_vol._30_final (viewed Apr 2025).
- 19. Jolly S, Chu MKW, Gupta AK, et al. Potentially avoidable mortality after endoscopic retrograde cholangiopancreatography in Australia: an 8‐year qualitative analysis. ANZ J Surg 2023; 93: 1825‐1832.
- 20. Liu DS, Fayed A, Evans P, et al. Understanding potentially preventable mortality following oesophago‐gastric cancer surgery: analysis of a national audit of surgical mortality. Ann Surg Oncol 2023; 30: 4950‐4961.
- 21. Chui JN, Papachristos AJ, Mechera R, et al. Unexpected deaths after endocrine surgery: learning from rare events using a national audit of surgical mortality. Br J Surg 2022; 109: 1164‐1171.
- 22. Mansour LT, Brien S, Reid J, Maddern GJ. Peri‐operative mortality following cholecystectomy in Australia: potential preventability of adverse events. World J Surg 2021; 45: 681‐689.
- 23. Hansen D, Itotoh F, Helena K, Aitken RJ; Australian and New Zealand Audit of Surgical Mortality. Observations from Australia's national surgical mortality audit. World J Surg 2023; 47: 3140‐3148.
- 24. Ounounou E, Aydin A, Brunckhorst O, et al. Nontechnical skills in surgery: a systematic review of current training modalities. J Surg Educ 2019; 76: 14‐24.
- 25. Wood TC, Raison N, Haldar S, et al. Training tools for nontechnical skills for surgeons: a systematic review. J Surg Educ 2017; 74: 548‐578.
- 26. Alegret N, Usart M, Valle A, et al. Improvement of teamwork nontechnical skills through polytrauma simulation cases using the communication and teamwork skills (CATS) assessment tool. J Surg Educ 2023; 80: 706‐713.
- 27. Caskey RC, Owei L, Rao R, et al. Integration of hands‐on team training into existing curriculum improves both technical and nontechnical skills in laparoscopic cholecystectomy. J Surg Educ 2017; 74: 915‐920.
- 28. Kim JS, Hernandez RA, Smink DS, et al. Nontechnical skills training in cardiothoracic surgery: a pilot study. J Thorac Cardiovasc Surg 2022; 163: 2155‐2162.
- 29. Granchi N, Reid J, Foley K, et al. Improving surgical excellence: first experience of a video‐based intervention in outpatients. ANZ J Surg 2022; 92: 2868‐2872.
- 30. Obuseh M, Anton NE, Gardiner R, et al. Development and application of a non‐technical skills coaching intervention framework for surgeons: a pilot quality improvement initiative. PLoS One 2024; 19: e0312125.
- 31. Liao CH, Ooyang CH, Chen CC, et al. Video coaching improving contemporary technical and nontechnical ability in laparoscopic education. J Surg Educ 2020; 77: 652‐660.
- 32. Catchpole KR, Dale TJ, Hirst DG, et al. A multicenter trial of aviation‐style training for surgical teams. J Patient Saf 2010; 6: 180‐186.
- 33. Pucher PH, Aggarwal R, Qurashi M, et al. Randomized clinical trial of the impact of surgical ward‐care checklists on postoperative care in a simulated environment. Br J Surg 2014; 10: 1666‐1673.
- 34. Granchi N, Ting YY, Foley KP, et al. Coaching to enhance qualified surgeons’ non‐technical skills: a systematic review. Br J Surg 2021; 108: 1154‐1161.
- 35. Keshtkar L, Bennett‐Weston A, Khan AS, et al. Impacts of communication type and quality on patient safety incidents: a systematic review. Ann Int Med 2025; 178: 687‐700.
Abstract
Objective: To compare the frequency of non‐technical errors in cases of surgical care‐related deaths in Australia, by surgical specialty.
Study design: Retrospective cohort study; analysis of Australian and New Zealand Audit of Surgical Mortality (ANZASM) data.
Setting, participants: All surgical care‐related deaths in Australia (except New South Wales), 1 January 2012 – 31 December 2019, that were flagged in ANZASM as associated with adverse events or areas of concern.
Main outcome measures: Proportions of surgical care‐related deaths associated with non‐technical errors, overall and by domain (communication/teamwork, decision making, situational awareness, leadership); paired comparisons of likelihood of errors by specialty; change in error proportions during 2012–2019; influence of patient and admission factors on likelihood of non‐technical errors.
Results: Of 30 971 surgical care‐related deaths reported to ANZASM during 2012–2019, 3695 were flagged with adverse events or areas of concern, including 3422 cases (92.6%) in five surgical specialties: general surgery (1570 deaths), cardiothoracic surgery (626), orthopaedic surgery (510), vascular surgery (385), and neurosurgery (331). The proportions of surgical care‐related deaths associated with non‐technical errors differed by specialty (range, 52.2% to 68.5%), as did those errors in the domains decision making (range, 52.6% to 66.3%) and situational awareness errors (range, 44.4% to 62.5%). The probability of any non‐technical error was greater for cardiothoracic than orthopaedic surgery (adjusted odds ratio [aOR], 1.76; 95% confidence interval [CI], 1.37–2.28), and for general than orthopaedic surgery (aOR, 1.97, 95% CI, 1.59–2.44) or neurosurgery (aOR, 1.47; 95% CI, 1.14–1.90); the probability was lower for orthopaedic than vascular surgery (aOR, 0.54; 95% CI, 0.41–0.72). The proportion of deaths associated with non‐technical errors declined over time for general surgery, but not the other four specialties. Differences by patient and admission characteristics in the proportions of cases including non‐technical errors were not statistically significant.
Conclusion: At least 50% of surgical care‐related deaths in five surgical specialties were associated with non‐technical errors, and the proportions did not substantially change during 2012–2019. Differences between specialties in the frequency of fatal non‐technical error suggest that targeted improvement strategies are needed, but the persistently high frequency for all specialties indicates that systemwide improvement is crucial.