


The known: Socio‐economic position is a major risk factor for chronic disease.
The new: The magnitude and consistency of the influence of socio‐economic position on disease prevalence varies by disease, measure of socio‐economic position, age, and sex. The Index of Relative Socio‐economic Disadvantage (IRSD) and income level more effectively predict risk than occupational grade or education level. The influence of socio‐economic position is less marked for people over 80 years of age and is often stronger for women than men.
The implications: Knowing whose health is most affected by socio‐economic disadvantage is integral to developing effective, targeted health policies and interventions.
Socio‐economic position is a major risk factor for the development of chronic disease. Lower socio‐economic position is associated with the higher prevalence of many diseases, but exceptions include breast and prostate cancer.1,2,3 Establishing which chronic diseases are associated with socio‐economic position is integral to developing more effective health interventions. However, many studies investigating links between socio‐economic position and health have been subject to selection bias.
Measures of socio‐economic position include income, education, occupational grade, and composite indices, each with its own strengths and limitations.4 These measures can be area‐ or individual‐based. Reported associations of specific measures with specific chronic diseases have been inconsistent, and many studies have not had sufficient statistical power for assessing associations. For example, those included in a 2007 meta‐analysis of the association between breast cancer and education were heterogeneous and yielded inconsistent findings; all were cohort studies that evaluated a subgroup of a national population.2
The response rate for the 2021 Australian National Census of Population and Housing was high (96%).5 Compulsory participation renders the very large census dataset uniquely representative of the entire Australian population. Some health care and administrative datasets in Europe and Asia capture data for entire nations, but often do not include detailed socio‐economic position information and are restricted to people who have received health care.
We therefore investigated differences in the prevalence of specific chronic diseases in Australia by selected measures of socio‐economic position, and by age group and sex, using representative national census population data. Our aim was to determine whether ten chronic diseases for which census data were available differed by area‐ and individual‐level measures of socio‐economic position.
Methods
For our retrospective, cross‐sectional, whole of population study, we analysed data from the 2021 Australian national census, a quinquennial questionnaire distributed to all people in Australia for completion on a specific date (in this case, 10 August 2021). It collects self‐reported demographic and socio‐economic data, but some variables included in the census dataset, such as income, are also derived from administrative databases. In 2021, census information about chronic diseases was collected for the first time. We report our study according to the STROBE guidelines.6
We obtained the data for our analysis using the Australian Bureau of Statistics TableBuilder.7 In TableBuilder, investigators select the variables they wish to cross‐tabulate, and export data tables as Excel (Microsoft) files. To protect the confidentiality of individuals, the numbers in each spreadsheet cell undergo perturbation;8 as the summative degree of perturbation increases with the number of variables included, we restricted the number of variables included in the analysis.
We examined the age‐standardised prevalence of ten chronic diseases — arthritis, asthma, cancer, dementia, diabetes (excluding gestational diabetes), heart disease, kidney disease, lung disease, mental health conditions, and stroke — by the following categorical variables:
- socio‐economic position measure: Index of Relative Socio‐economic Disadvantage (IRSD),9 weekly income, education, and occupational grade
- age group: 40–59, 60–79, 80 years or older; and
- sex: based on responses to the census question about sex.
Data were standardised to a reference population comprising all census respondents aged 40 years or older (one‐year intervals); this age group was selected because the prevalence of many chronic diseases is generally low in the younger age groups.
The IRSD is a composite, area‐based measure that summarises the economic and social conditions of people residing in a geographic area, based on their residential address. We used the finest iteration of IRSD, which was based on Statistical Areas level 1 (areas including 200 to 800 people).8 For income, respondent data were linked to Australian Tax Office and Department of Social Services databases. Income included wages, other income (including superannuation and investments), and government benefits. Income (weekly) was categorised as less than $500, $500–$999, $1000–$1499, $1500–$1999, $2000–$2999, $3000–$3999, $4000–$4999, $5000–$5999, $6000–$7999, or $8000 or more.
Education was defined as the highest reported educational attainment: no educational attainment, secondary education (year 9 or below), certificate I or II, secondary education (year 10 and above), certificate III or IV, diploma, and bachelor degree or postgraduate studies.10 Occupational grade was classified according to the Australian and New Zealand Standard Classification of Occupations (labourers, machinery operators or drivers, sales workers, clerical and administrative workers, community and personal service workers, technicians and trade workers, professionals, and managers).11 People not in the labour force were excluded from occupational grade analyses as we could not distinguish between people who were unemployed or retired.
Proportional changes in disease prevalence by socio‐economic position category were calculated using the Poisson regression β coefficient in the formula (eβ − 1) × 100. This was undertaken for IRSD and income only as we found consistent changes for these measures, but not for education or occupational grade.
Data management and statistical analyses were undertaken in R 4.4.0. Circular bar plots were generated using the circlize package.12
Ethics approval
This study was approved by the University of Melbourne Human Ethics Committee, Melbourne, Victoria, Australia (reference number 2024–29189–51684–2).
Results
Of the 25.4 million people for whom 2021 Australian census data were available, 12.3 million were aged 40 years or older, of whom 6.4 million (52%) were women. Residential and socio‐economic position data that allowed IRSD categorisation and health status responses were available for 11.3 million people in this age group (92%) (Box 1).
The proportions of people who reported nine chronic diseases (exception: cancer) increased with increasing socio‐economic disadvantage as measured by IRSD decile and income. The increases were less marked for people aged 80 years or older than for those aged 40–79 years, and they were more marked for women than for men (Box 2, Box 3).
For people aged 40–59 or 60–79 years, the increase in age‐standardised chronic disease prevalence per IRSD decile decrease was greatest for lung disease in both women (40–59 years, 18.4% per decile; 60–79 years, 10.6% per decile) and men (40–59 years, 16.9% per decile; 60–79 years, 11.0% per decile). For people aged 80 years or older, the increase in disease prevalence per IRSD decile decrease was greatest for kidney disease in women (6.0% per decile) and for mental health conditions in men (7.1% per decile) (Box 2, Box 3).
For people aged 40–59 or 60–79 years, the increase in age‐standardised chronic disease prevalence by lower income category was greatest for dementia in both women (40–59 years, 48.7% per category; 60–79 years, 20.8%) and men (40–59 years, 46.0% per category; 60–79 years, 17.7%). For people aged 80 years or older, the increase in prevalence by income was greatest for kidney disease in women (20.9% per category) and for mental health conditions in men (16.0% per category) (Box 2, Box 3).
The age‐standardised prevalence of cancer decreased by 0.4–1.1% per IRSD decile decrease for all age groups and both sexes, except for men aged 40−59 years (increased by 0.1% per decile); the prevalence increased by 0.4–3.3% per lower income category for all age groups and both sexes, except women aged 40−59 years (decreased by 0.3% per category) (Box 2, Box 3).
Changes in chronic disease prevalence with IRSD were more consistent than those with income across diseases, age groups, and sex; income explained a greater degree of variation in prevalence for certain sex–age groups. IRSD explained between 15% (men aged 80 years or more) and 61% (women aged 40–59 years) of variation in the prevalence of having at least one chronic disease. Income explained between 9% (men aged 80 years or more) and 83% (men aged 60–79 years). Income explained a greater proportion of variation in prevalence than IRSD for women aged 60–79 years and men aged 40–59 or 60–79 years; IRSD explained more variation in women aged 40–59 years and women and men aged 80 years or older (Supporting Information, figure 1).
The age‐standardised prevalence of chronic diseases was also influenced by education (Supporting Information, figure 2) and occupation level (Supporting Information, figure 3) but the associations were less consistent than the associations of prevalence with IRSD decile or income category.
Discussion
Using a national dataset of 11.3 million (IRSD) or 10.7 million adults (income), we found that the prevalence of chronic disease differed markedly by socio‐economic position; in contrast, the influence of education level and occupational grade was less consistent. The prevalence of nine of ten included diseases increased with socio‐economic disadvantage (IRSD and income); the exception was cancer, the prevalence of which decreased with increasing socio‐economic disadvantage in most sex‐specific age groups. Further, the increases in disease prevalence by IRSD or income level were more marked among people aged 40–78 years than in older people aged 80 years or older, and were often also more marked for women than for men.
Numerous factors could contribute to the socio‐economic position–disease gradients we report, including health behaviours, access to health care, nutritional status, health literacy, housing conditions, workload (including shift work), and psychological stress. Smoking rates are much higher among people in lower socio‐economic positions, and they are less likely to successfully quit.13 Smoking could mediate the influence of socio‐economic position on the prevalence of several chronic diseases, including lung disease, for which the increase in prevalence with decreasing IRSD decile was particularly large.
For people aged 40–79 years, changes in the prevalence of lung disease (IRSD) and dementia (income) with socio‐economic position were the most marked. People of lower socio‐economic position are more likely to have lung disease.14,15,16 In addition to smoking, air pollution and occupational exposure to lung toxins can be more frequent in more deprived areas than in affluent areas, contributing to the lung disease–socio‐economic position gradient.17,18 Dementia is also associated with lower socio‐economic position.19 This could be related to greater cognitive reserve in people of higher socio‐economic position, which is associated with reduced risk of dementia and earlier diagnosis.20,21 Given this propensity for earlier diagnosis, the socio‐economic position–disease gradient for dementia we report could overestimate the difference in the dementia burden between people of lower and higher socio‐economic position.
For people aged 80 years or older, increasing prevalence with lower IRSD and income levels was greatest for kidney disease in women and for mental health conditions in men. Lower socio‐economic position, as assessed by individual‐ and area‐based measures, has been associated with increasing burden of kidney disease.22 Negative health and social circumstances often coexist, have a cumulative effect on mental health and perpetuate each other, leading to greater social isolation, distress, and impaired quality of life.23
We found that the prevalence of other chronic diseases, including diabetes, also generally increased with lower socio‐economic position (IRSD or income level). Lower socio‐economic position has been associated with increased prevalence of diabetes and its complications.24,25
Our findings regarding cancer were different; the prevalence of cancer either declined or slightly increased with increasing socio‐economic disadvantage. In people of higher socio‐economic position, greater health care access can result in more frequent cancer screening and consequently detection.26 The lower prevalence of cancer among people of lower socio‐economic position could also reflect the types of cancers that are most frequently diagnosed in Australia: breast and prostate cancer. Breast cancer is associated with higher socio‐economic position.1,2 This association could be mediated by higher alcohol consumption, greater use of hormonal therapy, higher frequency of cancer screening, and later age of menopause among women of higher socio‐economic position.2,27 However, as we assessed the prevalence, not the incidence, of disease, the association of higher socio‐economic position with better survival28 may have influenced our findings. Prostate cancer risk is reported to be unrelated to or to increase with higher socio‐economic position.3 However, lower socio‐economic position is associated with higher prostate cancer mortality.29 When designing public health interventions, mortality risk should be considered in conjunction with disease prevalence. Lower cancer prevalence could partly reflect higher case fatality, and therefore does not reduce the need for better health interventions for people of lower socio‐economic position.
We found that changes in chronic disease prevalence with IRSD were more consistent than those with income. Income explained a greater proportion of variation in prevalence by socio‐economic position, but this may have been because of the income categories we used.
IRSD was the socio‐economic position measure most consistently related to chronic disease prevalence in our study and its effect varied by age group and sex. IRSD, a composite, area‐based measure that is updated after each Australian census, captures a range of socio‐economic position factors and can be used to monitor socio‐demographic changes in geographic regions over time. Many studies have found reasonable agreement between area‐ and individual‐level socio‐economic position measures,30,31 but not all.32,33 Area‐based measures can be correlated with disease prevalence because important health factors, such as health care access, are inherently area‐based. However, area‐based measures underestimate inter‐individual variation in socio‐economic position. Further, different area‐based measures perform differently according to their composition and the time period during which they are measured.
The lesser effect of socio‐economic position and disease we report for people aged 80 years or older could reflect the survivor effect; more unwell disadvantaged people are likely to die younger. Other studies have found that the socio‐economic position–disease gradient diverges with age, converges, or a mixture of both.33,34,35,36 In older age groups, age itself could be the predominant risk factor, rendering socio‐economic position less important. IRSD is based on residential address and younger people may be more mobile and choose to live in specific areas; this could lead to stronger socio‐economic position clustering in younger age groups than older age groups. Socio‐economic position can also change across the lifespan.
We found that changes in disease prevalence by IRSD and income level were often more marked for women than for men; this finding was more consistent for IRSD than for income. The association of greater excess risk of coronary heart disease with lower levels of education has been reported to be stronger for women than men;37 women with lower education may be less likely to seek medical attention for heart disease, including acute myocardial infarction, than men.38 Another study found that the reduced risk of depressive symptoms associated with higher income was greater in women than less educated men.39 However, this effect was only found using the multiplicative, not the additive scale, and biological susceptibility is better assessed using the additive scale.
We did not find that education level or occupational grade consistently influenced the prevalence of chronic disease. A higher level of education generally, but not always, corresponds to a higher IRSD decile and income level. However, the 2021 census was undertaken during the coronavirus disease 2019 (COVID‐19) pandemic, during which income was disrupted for some people. Further, in contemporary workforces it is difficult to clearly rank occupational grades by socio‐economic position. This might explain why the socio‐economic position gradients in chronic disease prevalence based on occupational grade were less consistent than those for IRSD and income.
We unexpectedly found that the burden of chronic disease was not greatest for people without formal educational qualifications. This finding might be explained by lower health literacy and health care‐seeking behaviour, leading to lower rates of disease detection. Conversely, the people in this group could be healthier than those with secondary schooling to year nine or below. For example, shift‐and‐persist strategies in some people of lower socio‐economic position can contribute to better physical health,40 suggesting that more resilience protects the health of some people of lower socio‐economic position. However, this effect was not reflected in our findings regarding the relationship between IRSD and chronic disease.
Strengths of our analysis include the very large sample size and census response rate, providing new, whole of population prevalence data for ten key health conditions and four socio‐economic position measures. Biases associated with typical volunteer epidemiological studies were virtually eliminated. Further, self‐reported disease status appeared to be reliable; for example, the sex and age patterns of diabetes based on census responses were similar to known distributions, including those determined by studies that defined diabetes using biochemical definitions or clinical documentation.41,42,43,44,45 Disease status could be reported in the census by other household members, which may have captured the prevalence of diseases such as dementia more accurately than people reporting their own diseases. Income data were derived from administrative data, removing the problems of potential bias and incomplete data inherent to the self‐reporting of income.
Limitations
As our study was cross‐sectional, causality cannot be inferred from our findings. Health status was self‐reported, the census asked only about diagnosed chronic diseases, and census data were perturbed to preserve privacy. People of lower socio‐economic position may have less access to health care and therefore be more likely to live with undetected disease. We may therefore have underestimated the influence of socio‐economic position on disease prevalence for cases in which greater social disadvantage was associated with higher prevalence. Only limited covariate data were available for adjusting our analyses.
Conclusion
We found marked socio‐economic gradients in the prevalence of chronic disease in Australia. However, the direction, magnitude, and consistency of the effect differed by disease, socio‐economic measure, age, and sex. The influence of socio‐economic position was more marked for women than men; despite some specific health interventions for women, further strategies are needed. Differences in the prevalence of some diseases by socio‐economic position were especially marked, with some variation across age groups. Groups at particular risk of these chronic diseases should be targeted by health interventions for reducing socio‐economic inequalities in health. Health interventions that measure socio‐economic position using IRSD or income, directed to groups at higher risk, should be investigated and evaluated. IRSD (composite area‐based measure) and income (individual‐level measure) were the socio‐economic position measures for which differences in disease prevalence were most consistent. Differences by the area‐based IRSD suggest that area‐based features, such as health care access, are important for reducing disease risk and narrowing health inequities.
Box 1 – Selection of people for inclusion in analyses of associations between measures of socio‐economic position and the prevalence of ten chronic diseases, based on data from the 2021 Australian census
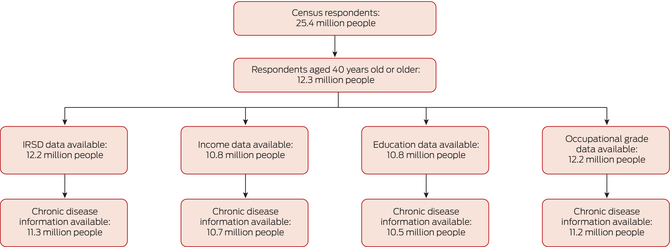
IRSD = Index of Relative Socioeconomic Disadvantage.
Box 2 – Age‐standardised prevalence of ten chronic diseases by Index of Relative Socioeconomic Disadvantage (IRSD) decile (outer circle), and mean proportional change in prevalence per one decile decrease in IRSD (inner circle), by sex and age group*
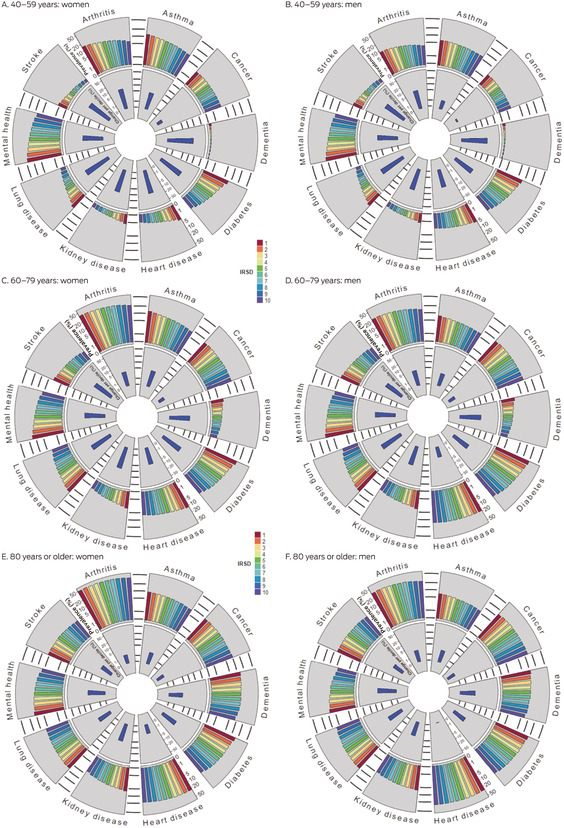
* IRSD decile 1 = most disadvantage, decile 10 = least disadvantage. The data underlying the proportional change component of this graph are included in the Supporting Information, table 1.
Box 3 – Age‐standardised prevalence of ten chronic diseases by weekly income category (outer circle), and mean proportional change in prevalence per one category decrease in income (inner circle), by sex and age group*
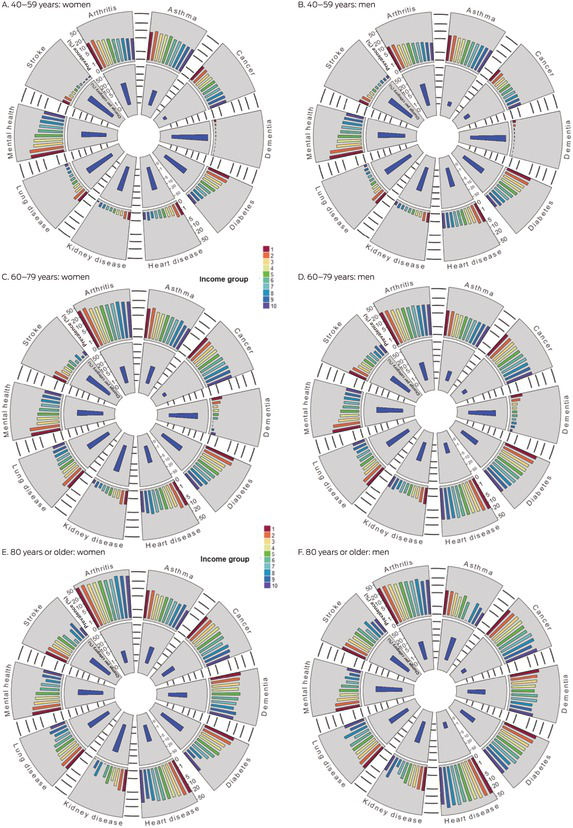
* Income categories (weekly income): less than $500, $500–$999, $1000–$1499, $1500–$1999, $2000–$2999, $3000–$3999, $4000–$4999, $5000–$5999, $6000–$7999, and $8000 or more. The data underlying the proportional change component of this graph are included in the Supporting Information, table 1.
Received 14 November 2024, accepted 2 May 2025
- Joanna Y Gong1,2,3,4,5
- Emily D Williams6
- Agus Salim1,4
- Spiros Fourlanos2,4
- Jonathan E Shaw1,5,7
- Dianna J Magliano1,5
- 1 Baker Heart and Diabetes Institute, Melbourne, VIC
- 2 The Royal Melbourne Hospital, Melbourne, VIC
- 3 Western Health, Melbourne, VIC
- 4 The University of Melbourne, Melbourne, VIC
- 5 Monash University, Melbourne, VIC
- 6 King’s College London, London, United Kingdom
- 7 La Trobe University, Melbourne, VIC
Correspondence: joannagong@unimelb.edu.au
Open access:
Open access publishing facilitated by The University of Melbourne, as part of the Wiley – the University of Melbourne agreement via the Council of Australian University Librarians.
Data Sharing:
No original data were generated by this study.
Dianna J Magliano and Jonathan E Shaw are supported by National Health and Medical Research Council Investigator grants. Joanna Y Gong holds National Health and Medical Research Council, National Heart Foundation of Australia, Rowden White, and Sheppard M Lowe scholarships. The funding sources had no role in study design, data collection, analysis or interpretation, reporting, or publication.
Jonathan E Shaw has received consulting fees from GlaxoSmithKline, and payment for lectures and work on a program committee for Astra Zeneca and lectures for Boehringer Ingelheim, Novo Nordisk, Roche, Zuellig Pharmaceutical, and Eli Lilly. Spiros Fourlanos has received consulting fees from Mylan and Pfizer, and presentation honoraria from Astra Zeneca, Boehringer Ingelheim, Eli Lilly, and Novo Nordisk.
Author contributions:
Dianna J Magliano: conceptualisation, methodology, writing (review and editing), visualisation, supervision. Jonathan E Shaw: conceptualisation, methodology, writing (review and editing), visualisation, supervision. Joanna Y Gong: conceptualisation, methodology, formal analysis, writing (review and editing), visualisation. Emily D Williams: conceptualisation, methodology, writing (review and editing), supervision. Agus Salim: methodology, formal analysis, writing (review and editing), visualisation, supervision. Spiros Fourlanos: writing (review and editing), supervision.
- 1. Australian Institute of Health and Welfare. Cancer in Australia 2021 (cat. no. CAN 144). Canberra: AIHW, 2021. https://www.aihw.gov.au/getmedia/0ea708eb‐dd6e‐4499‐9080‐1cc7b5990e64/aihw‐can‐144.pdf?v=20230605165731&inline=true (viewed June 2024).
- 2. Dong JY, Qin LQ. Education level and breast cancer incidence: a meta‐analysis of cohort studies. Menopause 2020; 27: 113‐118.
- 3. Kivimäki M, Batty GD, Pentti J, et al. Association between socioeconomic status and the development of mental and physical health conditions in adulthood: a multi‐cohort study. Lancet Public Health 2020; 5: e140‐e149.
- 4. Shavers VL. Measurement of socioeconomic status in health disparities research. J Natl Med Assoc 2007; 99: 1013‐1023.
- 5. Australian Bureau of Statistics. Snapshot of Australia, 2021. 28 June 2022. https://www.abs.gov.au/statistics/people/people‐and‐communities/snapshot‐australia/latest‐release (viewed Aug 2025).
- 6. Strengthening the reporting of observational studies in epidemiology (STROBE). STROBE checklist: cross‐sectional studies. https://www.strobe‐statement.org/checklists (viewed Aug 2025).
- 7. Australian Bureau of Statistics. TableBuilder. 8 Nov 2021. https://www.abs.gov.au/statistics/microdata‐tablebuilder/tablebuilder (viewed Aug 2025).
- 8. Australian Bureau of Statistics. Confidentiality and relative standard error. TableBuilder. 19 Nov 2021. https://www.abs.gov.au/statistics/microdata‐tablebuilder/tablebuilder/confidentiality‐and‐relative‐standard‐error (viewed Oct 2024).
- 9. Australian Bureau of Statistics. IRSD. In: Socio‐Economic Indexes for Areas (SEIFA), Australia, 2021. 27 Apr 2023. https://www.abs.gov.au/statistics/people/people‐and‐communities/socio‐economic‐indexes‐areas‐seifa‐australia/latest‐release#index‐of‐relative‐socio‐economic‐disadvantage‐irsd‐ (viewed Oct 2024).
- 10. Australian Bureau of Statistics. Level of highest educational attainment (HEAP); 2021. 15 Oct 2021. https://www.abs.gov.au/census/guide‐census‐data/census‐dictionary/2021/variables‐topic/education‐and‐training/level‐highest‐educational‐attainment‐heap (viewed Oct 2024).
- 11. Australian Bureau of Statistics. OSCA: occupation standard classification for Australia. 6 Dec 2024. https://www.abs.gov.au/statistics/classifications/anzsco‐australian‐and‐new‐zealand‐standard‐classification‐occupations/latest‐release (viewed Oct 2024).
- 12. Gu Z, Gu L, Eils R, et al. “Circlize” implements and enhances circular visualization in R. Bioinformatics 2014; 30: 2811‐2812.
- 13. Hiscock R, Bauld L, Amos A, et al. Socioeconomic status and smoking: a review. Ann N Y Acad Sci 2012; 1248: 107‐123.
- 14. Assari S, Chalian H, Bazargan M. Race, ethnicity, socioeconomic status, and chronic lung disease in the US. Res Health Sci 2020; 5: 48‐63.
- 15. Kanervisto M, Vasankari T, Laitinen T, et al. Low socioeconomic status is associated with chronic obstructive airway diseases. Resp Med 2011; 105: 1140‐1146.
- 16. Yin P, Zhang M, Li Y, et al. Prevalence of COPD and its association with socioeconomic status in China: findings from China Chronic Disease Risk Factor Surveillance 2007. BMC Public Health 2011; 11: 586.
- 17. Schluger NW, Koppaka R. Lung disease in a global context. A call for public health action. Ann Am Thorac Soc 2014; 11: 407‐416.
- 18. Hajat A, Hsia C, O’Neill MS. Socioeconomic disparities and air pollution exposure: a global review. Curr Environ Health Rep 2015; 2: 440‐450.
- 19. Wang AY, Hu HY, Ou YN, et al. Socioeconomic status and risks of cognitive impairment and dementia: a systematic review and meta‐analysis of 39 prospective studies. J Prev Alzheimers Dis 2023; 10: 83‐94.
- 20. Meng X, D’Arcy C. Education and dementia in the context of the cognitive reserve hypothesis: a systematic review with meta‐analyses and qualitative analyses. PLoS One 2012; 7: e38268.
- 21. Petersen JD, Wehberg S, Packness A, et al. Association of socioeconomic status with dementia diagnosis among older adults in Denmark. JAMA Netw Open 2021; 4: e2110432.
- 22. Patzer RE, McClellan WM. Influence of race, ethnicity and socioeconomic status on kidney disease. Nat Rev Nephrol 2012; 8: 533‐541.
- 23. Van Wilder L, Pype P, Mertens F, et al. Living with a chronic disease: insights from patients with a low socioeconomic status. BMC Fam Pract 2021; 22: 233.
- 24. Tatulashvili S, Fagherazzi G, Dow C, et al. Socioeconomic inequalities and type 2 diabetes complications: a systematic review. Diabetes Metab 2020; 46: 89‐99.
- 25. Bird Y, Lemstra M, Rogers M, Moraros J. The relationship between socioeconomic status/income and prevalence of diabetes and associated conditions: a cross‐sectional population‐based study in Saskatchewan, Canada. Int J Equity Health 2015; 14: 93.
- 26. Mottram R, Knerr WL, Gallacher D, et al. Factors associated with attendance at screening for breast cancer: a systematic review and meta‐analysis. BMJ Open 2021; 11: e046660.
- 27. Lundqvist A, Andersson E, Ahlberg I, et al. Socioeconomic inequalities in breast cancer incidence and mortality in Europe: a systematic review and meta‐analysis. Eur J Public Health 2016; 26: 804‐813.
- 28. Taheri M, Tavakol M, Akbari ME, et al. Relationship of socio economic status, income, and education with the survival rate of breast cancer: a meta‐analysis. Iran J Public Health 2019; 48: 1428‐1438.
- 29. Coughlin SS. A review of social determinants of prostate cancer risk, stage, and survival. Prostate Int 2020; 8: 49‐54.
- 30. Moss JL, Johnson NJ, Yu M, et al. Comparisons of individual‐and area‐level socioeconomic status as proxies for individual‐level measures: evidence from the Mortality Disparities in American Communities study. Popul Health Metr 2021; 19: 1.
- 31. Pampalon R, Hamel D, Gamache P. A comparison of individual and area‐based socio‐economic data for monitoring social inequalities in health. Health Rep 2009; 20: 85‐94.
- 32. Pardo‐Crespo MR, Narla NP, Williams AR, et al. Comparison of individual‐level versus area‐level socioeconomic measures in assessing health outcomes of children in Olmsted County, Minnesota, J Epidemiol Community Health 2013; 67: 305‐310.
- 33. Mather T, Banks E, Joshy G, et al. Variation in health inequalities according to measures of socioeconomic status and age. Aus N Z J Public Health 2014; 38: 436‐440.
- 34. Kim J, Durden E. Socioeconomic status and age trajectories of health. Soc Sci Med 2007; 65: 2489‐2502.
- 35. Sugisawa H, Harada K, Sugihara Y, et al. Socioeconomic status and self‐rated health of Japanese people, based on age, cohort, and period. Popul Health Metr 2016; 14: 27.
- 36. Schöllgen I, Huxhold O, Tesch‐Römer C. Socioeconomic status and health in the second half of life: findings from the German Ageing Survey. Eur J Ageing 2010; 7: 17‐28.
- 37. Backholer K, Peters SA, Bots SH, et al. Sex differences in the relationship between socioeconomic status and cardiovascular disease: a systematic review and meta‐analysis. J Epidemiol Community Health 2017; 71: 550‐557.
- 38. Bugiardini R, Ricci B, Cenko E, et al. Delayed care and mortality among women and men with myocardial infarction. J Am Heart Assoc 2017; 6: e005968.
- 39. Peplinski B, McClelland R, Szklo M. Associations between socioeconomic status markers and depressive symptoms by race and gender: results from the Multi‐Ethnic Study of Atherosclerosis (MESA). Ann Epidemiol 2018; 28: 535‐542.
- 40. Chen E, Miller GE. “Shift‐and‐persist” strategies: why low socioeconomic status isn’t always bad for health. Perspect Psychol Sci 2012; 7: 135‐158.
- 41. Hutchinson MS, Joakimsen RM, Njølstad I, et al. Effects of age and sex on estimated diabetes prevalence using different diagnostic criteria: the Tromsø OGTT study. Int J Endocrinol 2013; 2013: 613475.
- 42. Meeks KA, Freitas‐Da‐Silva D, Adeyemo A, et al. Disparities in type 2 diabetes prevalence among ethnic minority groups resident in Europe: a systematic review and meta‐analysis. Intern Emerg Med 2016; 11: 327‐340.
- 43. Karter AJ, Schillinger D, Adams AS, et al. Elevated rates of diabetes in Pacific Islanders and Asian subgroups: the Diabetes Study of Northern California (DISTANCE). Diabetes Care 2013; 36: 574‐579.
- 44. Fleming D, Schellevis F, Van Casteren V. The prevalence of known diabetes in eight European countries. Eur J Public Health 2004; 14: 10‐14.
- 45. Kautzky‐Willer A, Leutner M, Harreiter J. Sex differences in type 2 diabetes. Diabetologia 2023; 66: 986‐1002.
Abstract
Objectives: To investigate differences in the prevalence of specific chronic diseases in Australia by selected measures of socio‐economic position, and by age group and sex, using representative national census population data.
Study design: Cross‐sectional, whole of population study; analysis of 2021 Australian census data.
Participants, setting: People aged 40 years or older for whom 2021 Australian census health status and socio‐economic position‐related data were available.
Main outcome measures: Age‐standardised prevalence of ten chronic diseases (arthritis, asthma, cancer, dementia, diabetes, heart disease, kidney disease, lung disease, mental health conditions, and stroke), by socio‐economic position (Index of Relative Socio‐economic Disadvantage [IRSD], income category, educational level, occupational grade), age group, and sex; mean change in prevalence across socio‐economic position categories.
Results: Health status responses and data that allowed IRSD categorisation were available for 11.3 million people aged 40 years or older (92% of all adults aged 40 years or older). The proportions of people who reported nine chronic diseases (exception: cancer) increased with increasing socio‐economic disadvantage as measured by IRSD decile and income. The increases were less marked for people aged 80 years or older than for those aged 40–79 years, and more marked for women than men. For people aged 40–59 or 60–79 years, the increase in age‐standardised chronic disease prevalence per one decile decrease in IRSD was greatest for lung disease in both women (40–59 years, 18.4% per decile; 60–79 years, 10.6% per decile) and men (40–59 years, 16.9% per decile; 60–79 years, 11.0% per decile). In people aged 80 years or older, the increase in prevalence per one decile decrease in IRSD was greatest for kidney disease in women (6.0% per decile) and for mental health conditions in men (7.1% per decile). The age‐standardised prevalence of cancer decreased by 0.4–1.1% per one decile decrease in IRSD for all age groups and both sexes, except for men aged 40−59 years (increased by 0.1% per IRSD decile). Consistent relationships with educational level or occupational grade were not found.
Conclusions: The prevalence of chronic disease differs by socio‐economic position, but the direction, magnitude, and consistency of the effect differs by disease, socio‐economic position measure, age, and sex. Understanding the relationship between different socio‐economic position measures and chronic diseases facilitates the formulation of directed interventions.